ETFs
WDIV: own other dividend ETFs instead

MicroStockHub
ETF Overview
SPDR® S&P Global Dividend ETF (NYSEARCA:WDIV) has a portfolio of international dividend stocks. Dividend-paying stocks from the United States, Canada and Japan made up more than half of WDIV’s portfolio. The fund currently has a dividend yield of around 4.7%, only slightly above the 10-year Treasury rate. The fund has had a lower total return than other international dividend growth funds over the past 10 years. Therefore, we think investors might instead look for other dividend funds.

Y Charts
Fund analysis
Portfolio construction methodology
WDIV tracks the S&P Global Dividend Aristocrats Index. To be included in this index, stocks must have increased their dividends or paid stable dividends for at least 10 consecutive years. The index selects the top 100 qualified stocks offering the highest returns. It limits the weight of each stock to 3% of the index. Additionally, no country can represent more than 25% of the index and no more than 20 stocks from any one country can be included. Each sector is also capped at 25% of the index, and no more than 20 stocks can come from the same sector.
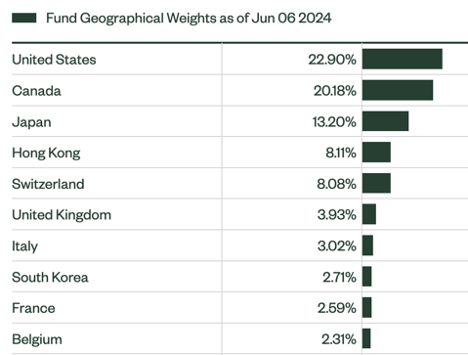
WDIV is concentrated in three countries
Despite the capping limit for each country at 25% of the portfolio, WDIV remains heavily concentrated in a few countries. U.S. stocks make up about 22.9% of its total portfolio. Next come Canada (20.2%) and Japan (13.2%). Together, stocks from these three countries represent approximately 56.3% of WDIV’s portfolio. We are not concerned about WDIV’s heavy focus on these three countries because they are developed countries with a stable political and economic environment.

SPDR
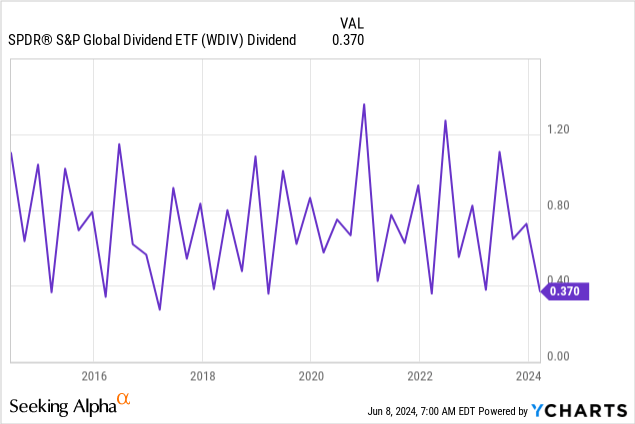
The dividend has remained fairly stable since its creation
WDIV’s portfolio construction methodology of focusing on stable dividend-paying stocks has resulted in relatively stable dividends. As shown in the chart below, the dividend paid by WDIV over the last 10 years has ranged between $0.3 and $1.2. The exact value varies depending on the season of the year. Dividend differences depending on the year depend on many factors. One of the main factors is the exchange rate. If we eliminate this factor, WDIV’s dividend should look even more stable.

Y Charts
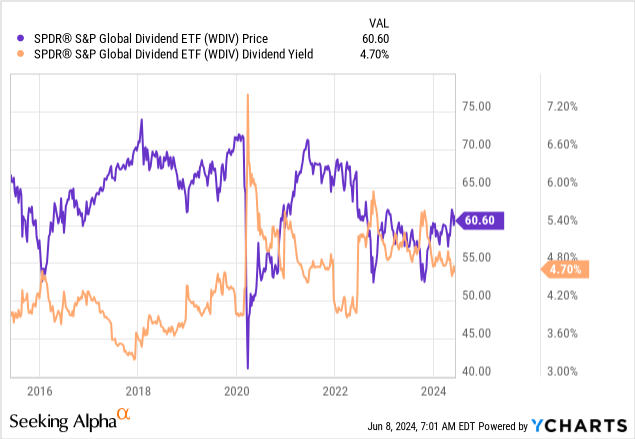
WDIV’s stable dividend has also translated into a stable dividend yield. As the chart below shows, its dividend yield has typically ranged between 3.6% and 5% for most of the past 10 years. Its current yield is about 4.7%, only slightly higher than the current 10-year Treasury rate of 4.4%.
Y Charts
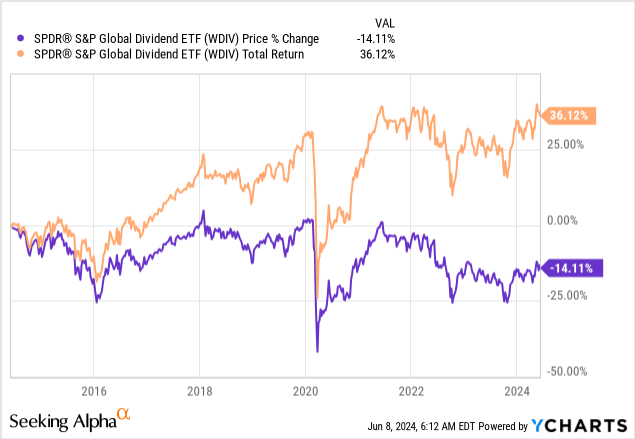
Unattractive total return
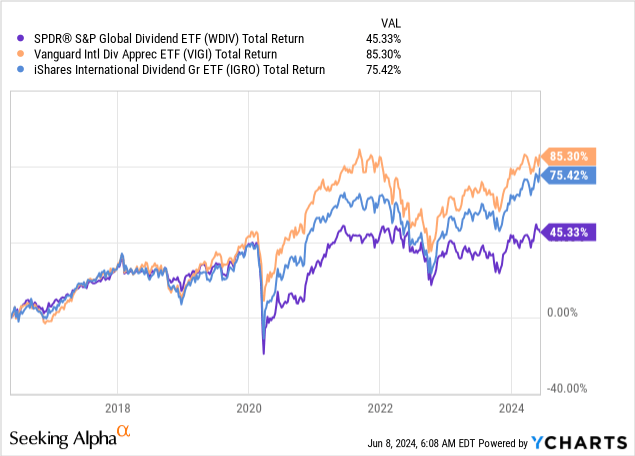
The biggest downside to owning WDIV is its unimpressive total returns. Not counting dividend yields, the fund has generated a negative price return of 14.1% since its inception in 2014. The chart below compares WDIV’s total return with that of two other international dividend growth funds: Vanguard International Dividend Appreciation ETF (VIGI) and iShares International Dividend Growth ETF (IGRO). As shown in the chart below, WDIV’s total return (including dividend) was only 45.33% since 2015. This figure was much lower than VIGI’s total return of 85.3% and that of IGRO of 75.4%.

Y Charts
We believe WDIV’s lower performance is due to its portfolio construction methodology. As we mentioned earlier, the fund may include stocks capable of paying stable dividends with or without increasing their dividends over the past 10 years or more. Additionally, stocks offering higher yields are ranked higher on the list. These higher yielding stocks generally have lower growth prospects (thus lower stock prices), and because of their lower growth prospects, their earnings cannot grow quickly over time. This therefore limits their ability to increase their dividends in the long term. The result is a portfolio of stocks likely to pay stable dividends, but with limited growth potential. In contrast, IGRO and VIGI emphasize holding stocks whose dividends have consistently increased in the past and/or have the potential to increase their dividends in the future. IGRO and VIGI’s focus on dividend growth has produced much better total returns over the long term.
The Federal Funds Rate May Impact WDIV’s Price Performance
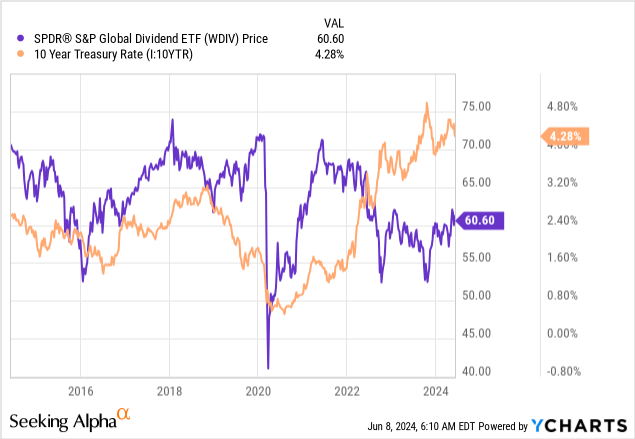
Since a large majority of WDIV’s portfolio includes international stocks outside of the United States, its fund’s price can be affected by exchange rates. A strong US dollar generally compresses the price of the WDIV fund and vice versa. The strength of the US dollar is generally influenced by the US Treasury rate. Here we will use the 10-year Treasury rate to illustrate this. As the chart below shows, the price of the WDIV fund has an inverse correlation with the Treasury rate. Since the start of 2022, rising Treasury rates have caused the price of the WDIV fund to remain quite low. The good news is that we are probably already at or near the peak of this rate hike cycle. Therefore, we could see outperformance if the Federal Reserve decides to adopt an accommodative monetary policy. However, we know that fighting inflation is not an easy task, as inflation often carries a self-fulfilling prophecy. Therefore, the Federal Reserve may need to keep rates high for a long time. So investors should keep this in mind.
Y Charts
Takeaways for investors
WDIV does not offer better returns than other international dividend growth funds. While its 4.7% dividend yield isn’t bad, it’s only slightly higher than the 10-year Treasury yield. If we take into account the exchange rate risk, this return is not particularly attractive either. We think investors could instead consider other dividend funds.
Additional Disclosure: This is not financial advice and all financial investments involve risk. Investors are expected to seek professional financial advice before making any investment.