ETFs
ETF for inflation: is the FCPI better than the FDRR? (BATS: FCPI)

Dragon Claws
Characteristics and strategies
Fidelity Stocks ETF for Inflation (BATS:FCPI) And Fidelity Dividend ETF for Rising Rates (FDRR) are two funds designed for an inflationary environment. The following table compares some of their features. They have the same expense ratio. FDRR is 3 years older and more than 3 times larger in terms of assets under management. It also has a higher dividend yield and lower turnover.
|
FCPI |
FDRR |
|
|
Creation |
05/11/2019 |
09/12/2016 |
|
Expense ratio |
0.15% |
0.15% |
|
Assets under management |
$162.66 million |
$537.86 million |
|
Div. TTM Yield |
1.51% |
2.52% |
|
Assets |
104 |
129 |
|
Turnover |
105% |
29% |
Click to enlarge
The two underlying indices have different strategies, as described in the prospectuses. FCPI focuses on fundamentals and momentum, while FDRR looks for dividends and correlation with Treasury yields.
The Fidelity Stocks for Inflation Factor Index is designed to reflect the performance of stocks of large- and mid-cap U.S. companies with attractive valuations, high-quality profiles and signals of positive momentum, with an emphasis on sectors that tend to outperform in inflationary environments.
The Fidelity Dividend for Rising Rates Index is designed to reflect the performance of stocks of large- and mid-cap dividend-paying companies that are expected to continue to pay and grow their dividends and whose returns are positively correlated with increases in dividend yields. 10-year US Treasury. yields.
Wallets
Technology is the largest sector in both funds, but FDRR is more concentrated, with 31.6% of asset value in technology companies. Second position goes to health in the FCPI (16.8%) and finance in the FDRR (13.5%). The other sectors in 3rd position are below 11% in both funds. The FCPI is significantly heavier in defensive sectors (healthcare, consumer staples, utilities) and in durable asset sectors (energy, materials, real estate).
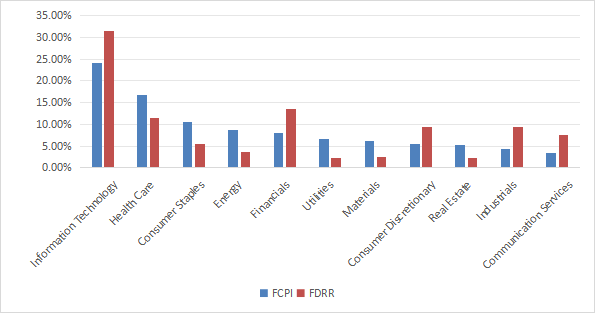

Sector distribution (Graph: author; data: Fidelity)
Both ETFs hold about a third of their asset value in their top 10 holdings, listed in the following table with their % weightings. The first 3 names are the same on both sides (Microsoft, Apple and NVIDIA), but they are significantly heavier in FDRR: 21.2% compared to 14.8% in total.
|
FCPI |
Top 10 titles |
33.32 |
FDRR |
Top 10 titles |
34.08 |
|
Microsoft Corporation |
5.26 |
MSFT |
Microsoft Corporation |
7.28 |
|
|
Apple Inc. |
4.81 |
NVDA |
NVIDIA Company |
7.21 |
|
|
NVIDIA Company |
4.76 |
AAPL |
Apple Inc. |
6.72 |
|
|
Vistra Corp. |
4.34 |
Broadcom Inc. |
2.27 |
||
|
Eli Lilly and company |
2.64 |
THERE IS |
Eli Lilly and company |
2.26 |
|
|
Rope Energy Corporation |
2.36 |
JPMorgan Chase & Co. |
1.93 |
||
|
CF Industries Holdings, Inc. |
2.34 |
Dell Technologies Inc. |
1.67 |
||
|
South West Energy Company |
2.28 |
UnitedHealth Group Incorporated |
1.67 |
||
|
The Procter & Gamble Company |
2.27 |
Texas Instruments Incorporated |
1.56 |
||
|
National Fuel Gas Company |
2.26 |
Visa Inc. Class A |
1.51 |
Click to enlarge
Fundamentals
The FCPI is cheaper than the FDRR based on valuation parameters, with the exception of the price/book value ratio, which is quite unreliable anyway. Additionally, FCPI also has much higher growth rates.
|
FCPI |
FDRR |
|
|
P/S TTM |
18.11 |
20 |
|
Price/Reservation |
3.93 |
2.72 |
|
Price/Sales |
1.74 |
1.84 |
|
Price/cash flow |
11:65 a.m. |
12:46 p.m. |
|
Profit growth |
29.63% |
24.67% |
|
Sales growth |
12.24% |
5.30% |
|
Cash Flow Growth |
18.92% |
-1.26% |
Click to enlarge
Data source: Fidelity.
Historical performance
Since its creation in November 2019, the FCPI has outperformed the FDRR by 14.7% in total return. Nonetheless, both ETFs lag the S&P 500 Index, represented on the following chart by SPDR® S&P 500 ETF Trust (TO SPY).
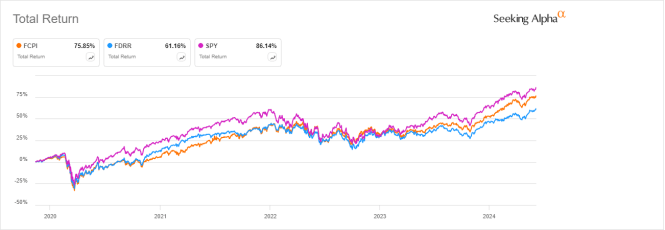
FCPI vs. FDRR since 11/11/2019 (Seeking Alpha)
Over the last 12 months, FCPI is also ahead of FDRR and SPY:
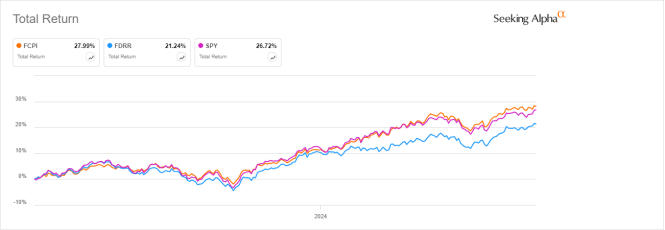
FCPI vs FDRR returns over 12 months (Seeking Alpha)
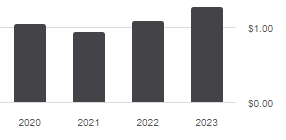
Annualized distributions present a more regular growth profile for FDRRs than for FCPIs, as shown in the two graphs below.
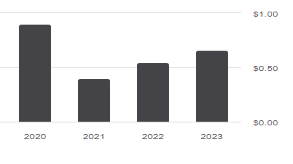

FCPI distribution history since 2020 (Seeking Alpha)

FDRR distribution history since 2020 (Seeking Alpha)
Take away
The following table summarizes the comparison.
|
FCPI |
FDRR |
|
|
Size and liquidity |
earn |
|
|
Revenue (lower is better) |
earn |
|
|
Dividend yield |
earn |
|
|
Dividend Growth |
earn |
|
|
Diversification (sector and main securities) |
earn |
|
|
Value |
earn |
|
|
Growth |
earn |
|
|
Back |
earn |
Click to enlarge
Obviously, the Return category is the most important point, especially since inflation and Treasury yields have been rising since 2020. This period is particularly relevant for evaluating the strategies of these funds. In my opinion, the second most important point is diversification because it is a risk reduction factor.
So, even though FCPI and FDRR won in the same number of topics, I consider FCPI to be the winner. Additionally, its sector profile is more defensive, which can mitigate volatility in the event of a market downturn. However, the Fidelity Stocks for Inflation ETF has yet to prove its superiority over the benchmark S&P 500 index.