News
Trends and Facts on Newspapers | State of the News Media

Newspapers are a critical part of the American news landscape, but they have been hit hard as more and more Americans consume news digitally. The industry’s financial fortunes and subscriber base have been in decline since the mid-2000s, and their website audience traffic has begun to decline as well. Explore the patterns and longitudinal data of U.S. newspapers below.
Audience
In 2022, estimated total U.S. daily newspaper circulation (print and digital combined) was 20.9 million for both weekday and Sunday, down 8% and 10% respectively from 2021.
Total estimated circulation of U.S. daily newspapers
Total circulation of U.S. daily newspapers
| 1940 | 41,132,000 | 32,371,000 | ||
| 1945 | 48,384,000 | 39,860,000 | ||
| 1946 | 50,928,000 | 43,665,000 | ||
| 1947 | 51,673,000 | 45,151,000 | ||
| 1948 | 52,285,000 | 46,308,000 | ||
| 1949 | 52,846,000 | 46,399,000 | ||
| 1950 | 53,829,000 | 46,582,000 | ||
| 1951 | 54,018,000 | 46,279,000 | ||
| 1952 | 53,951,000 | 46,210,000 | ||
| 1953 | 54,472,000 | 45,949,000 | ||
| 1954 | 55,072,000 | 46,176,000 | ||
| 1955 | 56,147,000 | 46,448,000 | ||
| 1956 | 57,102,000 | 47,162,000 | ||
| 1957 | 57,805,000 | 47,044,000 | ||
| 1958 | 57,418,000 | 46,955,000 | ||
| 1959 | 58,300,000 | 47,848,000 | ||
| 1960 | 58,882,000 | 47,699,000 | ||
| 1961 | 59,261,000 | 48,216,000 | ||
| 1962 | 59,849,000 | 48,888,000 | ||
| 1963 | 58,905,000 | 46,830,000 | ||
| 1964 | 60,412,000 | 48,383,000 | ||
| 1965 | 60,358,000 | 48,600,000 | ||
| 1966 | 61,397,000 | 49,282,000 | ||
| 1967 | 61,561,000 | 49,224,000 | ||
| 1968 | 62,535,000 | 49,693,000 | ||
| 1969 | 62,060,000 | 49,675,000 | ||
| 1970 | 62,108,000 | 49,217,000 | ||
| 1971 | 62,231,000 | 49,665,000 | ||
| 1972 | 62,510,000 | 50,001,000 | ||
| 1973 | 63,147,000 | 51,717,000 | ||
| 1974 | 61,877,000 | 51,679,000 | ||
| 1975 | 60,655,000 | 51,096,000 | ||
| 1976 | 60,977,000 | 51,565,000 | ||
| 1977 | 61,495,000 | 52,429,000 | ||
| 1978 | 61,990,000 | 53,990,000 | ||
| 1979 | 62,223,000 | 54,380,000 | ||
| 1980 | 62,202,000 | 54,676,000 | ||
| 1981 | 61,431,000 | 55,180,000 | ||
| 1982 | 62,487,000 | 56,261,000 | ||
| 1983 | 62,645,000 | 56,747,000 | ||
| 1984 | 63,340,000 | 57,574,000 | ||
| 1985 | 62,766,000 | 58,826,000 | ||
| 1986 | 62,502,000 | 58,925,000 | ||
| 1987 | 62,826,000 | 60,112,000 | ||
| 1988 | 62,695,000 | 61,474,000 | ||
| 1989 | 62,649,000 | 62,008,000 | ||
| 1990 | 62,328,000 | 62,635,000 | ||
| 1991 | 60,687,000 | 62,068,000 | ||
| 1992 | 60,164,000 | 62,160,000 | ||
| 1993 | 59,812,000 | 62,566,000 | ||
| 1994 | 59,305,000 | 62,295,000 | ||
| 1995 | 58,193,000 | 61,229,000 | ||
| 1996 | 56,983,000 | 60,798,000 | ||
| 1997 | 56,728,000 | 60,486,000 | ||
| 1998 | 56,182,000 | 60,066,000 | ||
| 1999 | 55,979,000 | 59,894,000 | ||
| 2000 | 55,773,000 | 59,421,000 | ||
| 2001 | 55,578,000 | 59,090,000 | ||
| 2002 | 55,186,000 | 58,780,000 | ||
| 2003 | 55,185,000 | 58,495,000 | ||
| 2004 | 54,626,000 | 57,754,000 | ||
| 2005 | 53,345,000 | 55,270,000 | ||
| 2006 | 52,329,000 | 53,179,000 | ||
| 2007 | 50,742,000 | 51,246,000 | ||
| 2008 | 48,597,000 | 49,115,000 | ||
| 2009 | 45,653,000 | 46,164,000 | ||
| 2010 | — | — | ||
| 2011 | 44,421,000 | 48,510,000 | ||
| 2012 | 43,433,000 | 44,821,000 | ||
| 2013 | 40,712,000 | 43,292,000 | ||
| 2014 | 40,420,000 | 42,751,000 | ||
| 2015 | 37,711,860 | 40,955,458 | ||
| 2016 | 34,657,199 | 37,801,888 | ||
| 2017 | 30,948,419 | 33,971,695 | ||
| 2018 | 28,554,137 | 30,817,351 | ||
| 2019 | 25,952,584 | 27,389,866 | ||
| 2020 | 24,299,333 | 25,785,036 | ||
| 2021 | 22,697,243 | 23,351,326 | ||
| 2022 | 20,943,023 | 20,943,889 |
Note: To determine totals for 2015 onward, researchers analyzed the year-over-year change in total weekday and Sunday circulation using AAM data and applied these percent changes to the previous year’s total. Only those daily U.S. newspapers that report to AAM are included. Affiliated publications are not included in the analysis. Weekday circulation only includes those publications reporting a Monday-Friday average. Comparisons are either between the three-month averages for the period ending Dec. 31 of the given year and the same period of the previous year (2015-2019), the six-month period ending Sept. 30 and the three-month period ending Sept. 30 of the previous year (2020), or the six-month period ending Sept. 30 of the given year and the same period of the previous year (2021-2022).
Source: Editor & Publisher (through 2014); estimate based on Pew Research Center analysis of Alliance for Audited Media data (2015-2022).
PEW RESEARCH CENTER
ChartDataShare
(Note that the Alliance for Audited Media (AAM), the source of this circulation data and the group that audits the circulation figures of many of the largest North American newspapers and other publications, changed their reporting period in 2020 from a three-month period to a six-month period. Additional details about how the circulation estimate is calculated can be found in the methodological note below.)
Within this total circulation figure, weekday print circulation decreased 13% and Sunday print circulation decreased 16% from the previous year.
Digital circulation is more difficult to gauge. Using only the AAM data, digital circulation in 2022 is projected to have remained relatively stable. But three of the highest-circulation daily papers in the U.S. – The New York Times, The Wall Street Journal and The Washington Post – have in recent years not fully reported their digital circulation to AAM. The Times and the Journal provide data on digital subscriptions in publicly available reports, but since this is not the same as circulation and may not be counted under the same rules used by AAM, these independently produced figures cannot easily be merged with the AAM data. If these independently produced figures were included with the AAM data in both 2021 and 2022, weekday digital circulation would have risen sharply, by 22%.
Estimated newspaper circulation using two different data sources
Total weekday circulation of U.S. daily newspapers using data from …
| 2016 | 34,657,199 | 34,657,199 |
| 2017 | 30,948,419 | 33,291,558 |
| 2018 | 28,554,137 | 32,961,320 |
| 2019 | 25,952,584 | 32,359,455 |
| 2020 | 24,299,333 | 35,644,533 |
| 2021 | 22,697,243 | 38,216,679 |
| 2022 | 20,943,023 | 42,972,898 |
Note: Researchers analyzed the year-over-year change in total weekday circulation using AAM data and applied these percent changes to the previous year’s total. Only those daily U.S. newspapers that report to AAM are included. Affiliated publications are not included in the analysis. Weekday circulation only includes those publications reporting a Monday-Friday average. Comparisons are either between the three-month averages for the period ending Dec. 31 of the given year and the same period of the previous year (2016-2019), the six-month period ending Sept. 30 and the three-month period ending Sept. 30 of the previous year (2020), or the six-month period ending Sept. 30 of the given year and the same period of the previous year (2021-2022).
Source: Estimate based on Pew Research Center analysis of Alliance for Audited Media data and subscription data from SEC filings and audited reports.
PEW RESEARCH CENTER
ChartDataShare
The addition of these figures also changes the overall picture for combined print and digital circulation. Before 2020, including these subscription numbers with the AAM circulation data would not have changed the overall circulation picture, as total circulation would still decline. From 2020 onward, however, including the Times’ and the Journal’s digital subscribers reverses the trend. In 2022, total weekday circulation would rise by 12% – not fall by 8%, as is the case when looking strictly at the AAM data. For comparison, the chart above shows estimated total weekday circulation using just the AAM data and when the digital subscriber numbers from the Times and Journal are included over the past seven years. For more details on how this affects our estimates and conclusions, read this post from 2020 on our Decoded blog.
Unique visitors of newspaper websites
Average monthly unique visitors to the top 50 U.S. newspapers by circulation
| 2014 | 8,233,544 |
| 2015 | 9,709,071 |
| 2016 | 11,734,536 |
| 2017 | 11,527,744 |
| 2018 | 11,600,124 |
| 2019 | 12,149,197 |
| 2020 | 13,866,542 |
| 2021 | 11,119,111 |
| 2022 | 8,839,848 |
Note: For each year, the average traffic for each website for October/November/December was calculated; the data point represents the overall average of those numbers. Analysis is of the top 49 newspapers by average Sunday circulation for Q3 2015-2019 and the six-month period ending Sept. 30 for 2020 onward, according to Alliance for Audited Media data, with the addition of The Wall Street Journal. For each newspaper, the Comscore entity matching its homepage URL was analyzed.
Source: Comscore Media Metrix® Multi-Platform, US, Unique Visitors, October-December 2014-2022.
PEW RESEARCH CENTER
ChartDataShare
Gauging digital audience for the entire newspaper industry is difficult since many daily newspapers do not receive enough traffic to their websites to be measured by Comscore, the data source relied on here. Thus, the figures offered above reflect the top 50 U.S. daily newspapers based on circulation. In the fourth quarter of 2022, there were an average 8.8 million monthly unique visitors (across all devices) for these top 50 newspapers. This is down 20% from 2021, which itself was a 20% decrease from 2020.
(The list of top 50 papers is based on Sunday circulation but includes The Wall Street Journal, which does not report Sunday circulation to AAM. It also includes The Washington Post and The New York Times, which make the top 50 even though they do not fully report their digital circulation to AAM. For more details and the full list of newspapers, read our methodology.)
Visit duration of newspaper websites
Average minutes per visit for the top 50 U.S. newspapers by circulation
| 2014 | 2.59 |
| 2015 | 2.59 |
| 2016 | 2.45 |
| 2017 | 2.44 |
| 2018 | 2.32 |
| 2019 | 2.10 |
| 2020 | 1.82 |
| 2021 | 1.56 |
| 2022 | 1.48 |
Note: For each year, the average minutes per visit for each website for October/November/December was calculated; the data point represents the overall average of those numbers. Analysis is of the top 49 newspapers by average Sunday circulation for Q3 2015-2019 and the six-month period ending Sept. 30 for 2020 onward, according to Alliance for Audited Media data, with the addition of The Wall Street Journal. For each newspaper, the Comscore entity matching its homepage URL was analyzed.
Source: Comscore Media Metrix® Multi-Platform, US, Average Minutes Per Visit, October-December 2014-2022.
PEW RESEARCH CENTER
ChartDataShare
Average minutes per visit for the top 50 U.S. daily newspapers, based on circulation, was just under 1 minute and 30 seconds in Q4 2022. This represents a 43% decline from when we first began tracking this in Q4 2014, when the average minutes per visit was just over 2 minutes and 30 seconds.

Economics
The total estimated advertising revenue for the newspaper industry in 2022 was $9.8 billion, based on the Center’s analysis of financial statements for publicly traded newspaper companies. This is down 5% from 2021, a slight drop. Total estimated circulation revenue was $11.6 billion, compared with $11.5 billion in 2020.
Estimated advertising and circulation revenue of the newspaper industry
Total revenue of U.S. newspapers (in U.S. dollars)
| 1956 | 3,223,000,000 | 1,344,492,000 | ||
| 1957 | 3,268,000,000 | 1,373,464,000 | ||
| 1958 | 3,176,000,000 | 1,459,013,000 | ||
| 1959 | 3,526,000,000 | 1,549,576,000 | ||
| 1960 | 3,681,000,000 | 1,604,228,000 | ||
| 1961 | 3,601,000,000 | 1,684,319,000 | ||
| 1962 | 3,659,000,000 | 1,819,840,000 | ||
| 1963 | 3,780,000,000 | 1,901,820,000 | ||
| 1964 | 4,120,000,000 | 1,983,809,000 | ||
| 1965 | 4,426,000,000 | 2,023,090,000 | ||
| 1966 | 4,865,000,000 | 2,109,050,000 | ||
| 1967 | 4,910,000,000 | 2,180,242,000 | ||
| 1968 | 5,232,000,000 | 2,288,215,000 | ||
| 1969 | 5,714,000,000 | 2,425,446,000 | ||
| 1970 | 5,704,000,000 | 2,634,402,000 | ||
| 1971 | 6,167,000,000 | 2,833,320,000 | ||
| 1972 | 6,939,000,000 | 2,929,233,000 | ||
| 1973 | 7,481,000,000 | 3,037,820,000 | ||
| 1974 | 7,842,000,000 | 3,581,733,000 | ||
| 1975 | 8,234,000,000 | 3,921,515,000 | ||
| 1976 | 9,618,000,000 | 4,087,303,000 | ||
| 1977 | 10,751,000,000 | 4,310,236,000 | ||
| 1978 | 12,213,000,000 | 4,534,779,000 | ||
| 1979 | 13,863,000,000 | 4,950,542,000 | ||
| 1980 | 14,794,000,000 | 5,469,589,000 | ||
| 1981 | 16,527,000,000 | 6,206,141,000 | ||
| 1982 | 17,694,000,000 | 6,656,661,000 | ||
| 1983 | 20,581,000,000 | 7,044,098,000 | ||
| 1984 | 23,522,000,000 | 7,368,158,000 | ||
| 1985 | 25,170,000,000 | 7,659,297,000 | ||
| 1986 | 26,990,000,000 | 8,052,148,000 | ||
| 1987 | 29,412,000,000 | 8,399,032,000 | ||
| 1988 | 31,197,000,000 | 8,046,287,000 | ||
| 1989 | 32,368,000,000 | 8,370,324,000 | ||
| 1990 | 32,280,000,000 | |||
| 1991 | 30,349,000,000 | 8,697,679,000 | ||
| 1992 | 30,639,000,000 | 9,163,534,000 | ||
| 1993 | 31,869,000,000 | 9,193,802,000 | ||
| 1994 | 34,109,000,000 | 9,443,217,000 | ||
| 1995 | 36,092,000,000 | 9,720,186,000 | ||
| 1996 | 38,075,000,000 | 9,969,240,000 | ||
| 1997 | 41,330,000,000 | 10,065,642,000 | ||
| 1998 | 43,925,000,000 | 10,266,955,000 | ||
| 1999 | 46,289,000,000 | 10,472,294,000 | ||
| 2000 | 48,670,000,000 | 10,540,643,000 | ||
| 2001 | 44,305,000,000 | 10,783,078,000 | ||
| 2002 | 44,102,000,000 | 11,025,896,000 | ||
| 2003 | 46,156,000,000 | 11,224,362,000 | ||
| 2004 | 48,244,000,000 | 10,988,651,000 | ||
| 2005 | 49,435,000,000 | 10,746,901,000 | ||
| 2006 | 49,275,402,572 | 10,548,344,000 | ||
| 2007 | 45,375,000,000 | 10,294,920,096 | ||
| 2008 | 37,848,257,630 | 10,086,956,940 | ||
| 2009 | 27,564,000,000 | 10,066,783,026 | ||
| 2010 | 25,837,698,822 | 10,049,360,689 | ||
| 2011 | 27,078,473,864 | 9,989,064,525 | ||
| 2012 | 25,316,461,215 | 10,448,561,493 | ||
| 2013 | 23,587,097,435 | 10,641,662,892 | ||
| 2014 | 22,077,809,951 | 10,744,324,061 | ||
| 2015 | 20,362,238,293 | 10,870,292,720 | ||
| 2016 | 18,274,943,567 | 10,910,460,499 | ||
| 2017 | 16,476,453,084 | 11,211,011,020 | ||
| 2018 | 14,346,024,182 | 10,995,341,920 | ||
| 2019 | 12,864,064,241 | 11,016,643,128 | ||
| 2020 | 9,601,389,155 | 11,053,729,516 | ||
| 2021 | 10,264,430,205 | 11,524,949,565 | ||
| 2022 | 9,760,830,024 | 11,606,129,049 |
Source: News Media Alliance, formerly Newspaper Association of America (through 2012); Pew Research Center analysis of year-end SEC filings of publicly traded newspaper companies (2013-2022).
PEW RESEARCH CENTER
ChartDataShare
In the chart above, data through 2012 comes from the trade group formerly known as the Newspaper Association of America (NAA), now known as the News Media Alliance (NMA). Data from 2013 onward is based on the Center’s analysis of financial statements from publicly traded U.S. newspaper companies, which in 2022 numbered four and accounted for about 300 U.S. daily newspapers, from large national papers to midsize metro dailies and local papers.
From 2013 onward, the year-over-year percentage change in advertising and circulation revenue for these companies is calculated and then applied to the previous year’s revenue totals as reported by the NMA/NAA. In testing this method, changes from 2006 through 2012 generally matched those as reported by the NMA/NAA; for more details, read our 2016 report.
Share of newspaper advertising revenue coming from digital advertising
% of newspaper companies’ advertising revenue coming from digital advertising
| 2011 | 17% |
| 2012 | 19% |
| 2013 | 20% |
| 2014 | 21% |
| 2015 | 25% |
| 2016 | 29% |
| 2017 | 31% |
| 2018 | 35% |
| 2019 | 35% |
| 2020 | 39% |
| 2021 | 45% |
| 2022 | 48% |
Source: Pew Research Center analysis of year-end SEC filings for publicly traded newspaper companies that break out digital advertising revenue for each year.
PEW RESEARCH CENTER
ChartDataShare
Digital advertising accounted for 48% of newspaper advertising revenue in 2022, based on this analysis of publicly traded newspaper companies. This follows a steady increase from 17% in 2011, the first year it was possible to perform this analysis.
Methodological note
In this fact sheet, circulation data through 2014 is from Editor & Publisher, which was published on the website of the News Media Alliance (NMA), known at the time as the Newspaper Association of America (NAA). The NMA no longer supplies this data, so the Center determined the year-over-year change in total circulation for those daily U.S. newspapers that report to the Alliance for Audited Media and meet certain criteria. This percentage change was then applied to the total circulation from the prior year – thus the use of the term “estimated total circulation.” This technique is also used to create the revenue estimates, using the financial statements of publicly traded newspaper companies as the data source.

Find out more
This fact sheet was compiled by Research Assistants Sarah Naseer and Christopher St. Aubin.
Read the methodology.
Pew Research Center is a subsidiary of The Pew Charitable Trusts, its primary funder. This is the latest report in Pew Research Center’s ongoing investigation of the state of news, information and journalism in the digital age, a research program funded by The Pew Charitable Trusts, with generous support from the John S. and James L. Knight Foundation.
Find more in-depth explorations of U.S. newspapers by following the links below:
- After increasing in 2020, layoffs at large U.S. newspapers and digital news sites declined in 2021, Oct. 13, 2022
- News Platform Fact Sheet, Sept. 20, 2022
- Local Newspapers Fact Sheet, May 26, 2022
- U.S. newsroom employment has fallen 26% since 2008, July 13, 2021
- A third of large U.S. newspapers experienced layoffs in 2020, more than in 2019, May 21, 2021
- Coronavirus-Driven Downturn Hits Newspapers Hard as TV News Thrives, Oct. 29, 2020
- Nearly 2,800 newspaper companies received paycheck protection loans, and most were under $150K, Oct. 29, 2020
- Americans’ main sources for political news vary by party and age, April 1, 2020
- Black and white Democrats differ in their media diets, assessments of primaries, March 11, 2020
- Fast facts about the newspaper industry’s financial struggles as McClatchy files for bankruptcy, Feb. 14, 2020
- U.S. Media Polarization and the 2020 Election: A Nation Divided, Jan. 24, 2020
- For Local News, Americans Embrace Digital but Still Want Strong Community Connection, March 26, 2019
- What are the local news dynamics in your city?, March 26, 2019

The spotlight next week will shift somewhat to the Federal Reserve’s second-quarter earnings season and monetary policy. Market watchers will be treated to results from several major names, including Dow 30 components Goldman Sachs (GS), UnitedHealth (UNH), Johnson & Johnson (JNJ) and American Express (AXP), along with streaming giant Netflix (NFLX).
The Fed will still attract some attention as investors will be eager to hear from a packed lineup of central bank speakers just before the policy meeting lockout period.
In terms of the economic calendar, after fifteen days of labor market and inflation indicators, activity data will gain momentum in the form of the latest retail sales and industrial production reports.
Earnings Highlight: Monday, July 15 – Goldman Sachs (GS) and BlackRock (Black). See the full earnings calendar.
Earnings Highlight: Tuesday, July 16 – UnitedHealth (UNH), Bank of America (BAC), Progressive (PGR), Morgan Stanley (IN), PNC Financial (PNC) and JB Hunt Transport (JBHT). See the full earnings calendar.
Earnings Highlight: Wednesday, July 17 – Johnson & Johnson (JNJ), US Bancorp (USB), Morgan Children (KMI), United Airlines (UAL) and Ally Financial (ALLY). See the full earnings calendar.
Earnings Highlight: Thursday, July 18 – Netflix (NFLX), Abbott Laboratories (ABT), Black stone (BX), Domino’s pizza (ZDP) and Taiwan Semiconductor Manufacturing (TSM). See the full earnings calendar.
Earnings Highlight: Friday, July 19 – American Express (AXP), Halliburton (THANKS) and Travelers (VRT (return to recoverable value)) See the full earnings calendar.
IPO Observation: Hospital and healthcare clinic operator Ardent Health Partners (TARDT), insurance service provider Twfg (TWFG) and the biotechnology company Lirum Therapeutics (LRTX) are expected to price their IPOs and begin trading next week. The analyst quiet period ends at Rectitude (RECT) to free up analysts to publish ratings.

Police cars outside the residence of Thomas Matthew Crooks, the suspected shooter at a Trump rally on Saturday, investigate the area in Pennsylvania. Following the incident, one rally attendee was killed, two rally attendees are in critical condition and Donald Trump suffered a non-fatal gunshot wound. The shooter is dead after being shot dead by the United States Secret Service. (Photo by Kyle Mazza/Anadolu via Getty Images)
Investors will initially favor traditional safe-haven assets and may lean toward trades more closely tied to former President Donald Trump’s chances of winning the White House after he survived an assassination attempt, according to market watchers.
“There will undoubtedly be some protectionist or safe-haven flows into Asia early this morning,” said Nick Twidale, chief market analyst at ATFX Global Markets. “I suspect gold could test all-time highs, we’ll see the yen being bought and the dollar, and flows into Treasuries as well.”
Early market commentary suggested Trump’s shooting at a rally in Pennsylvania on Saturday could also prompt traders to increase his likelihood of success in the November election. His support for looser fiscal policy and higher tariffs is generally seen as likely to benefit the dollar and weaken Treasuries.
An indicator of market sentiment heading into the weekend: Bitcoin surged above $60,000, likely reflecting Trump’s pro-crypto stance.
Other assets positively linked to the so-called Trump trade include stocks of energy companies, private prisons, credit card companies and health insurers.
Traders will also be closely watching market measures of expected volatility on Monday, such as those in the tariff-sensitive Chinese yuan and Mexican peso, which have begun to price in the U.S. vote.
Trump said he was shot in the right ear after a shooting at his rally. His campaign said in a statement that he was “fine” after the incident, which prompted him to rush off the stage.
“Currencies will be the first major market on Monday in Asia to react to the weekend’s shots. There’s potential for extra volatility, and getting a clear reading could be especially difficult because liquidity will be hurt by Japan’s national holiday,” said Garfield Reynolds, Asia team leader for Bloomberg Markets Live.
Strategists had already expected a volatile run-up to the election, particularly as Democrats are still agonizing over President Joe Biden’s candidacy after his poor performance in last month’s debate raised questions about his age. Investors were also grappling with the possibility that the election could end in a drawn-out dispute or political violence.
But there is little precedent for events like those in Pennsylvania. When President Ronald Reagan was shot four decades ago, the stock market plunged before closing early. The next day, March 31, 1981, the S&P 500 rose more than 1% and benchmark 10-year Treasury yields fell 9 basis points to 13.13%, according to data compiled by Bloomberg.
Bond investors should pay particular attention as the attack is likely to boost Trump’s election chances and ultimately lead to concerns about the fiscal outlook, according to Marko Papic, chief strategist at California-based BCA Research Inc.
“The bond market must at some point become aware of President Trump’s greater chances of winning the White House than any of his rivals,” Papic wrote. “And I continue to believe that as his chances increase, so too must the likelihood of a bond market revolt.”
Kyle Rodda, senior financial markets analyst at Capital.com, said he was seeing client flows into Bitcoin and gold following the shooting.
“This news marks a turning point in American policy norms,” he said. “For markets, it means safe-haven trades, but more tilted toward non-traditional safe-havens.”
Follow us for stories on Bill Gates, Elon Musk, Mukesh Ambani, Gautam Adani as we bring you everything that’s happening in the business world. Follow the latest gold and silver prices here too. Stay in the know on all things business with us.
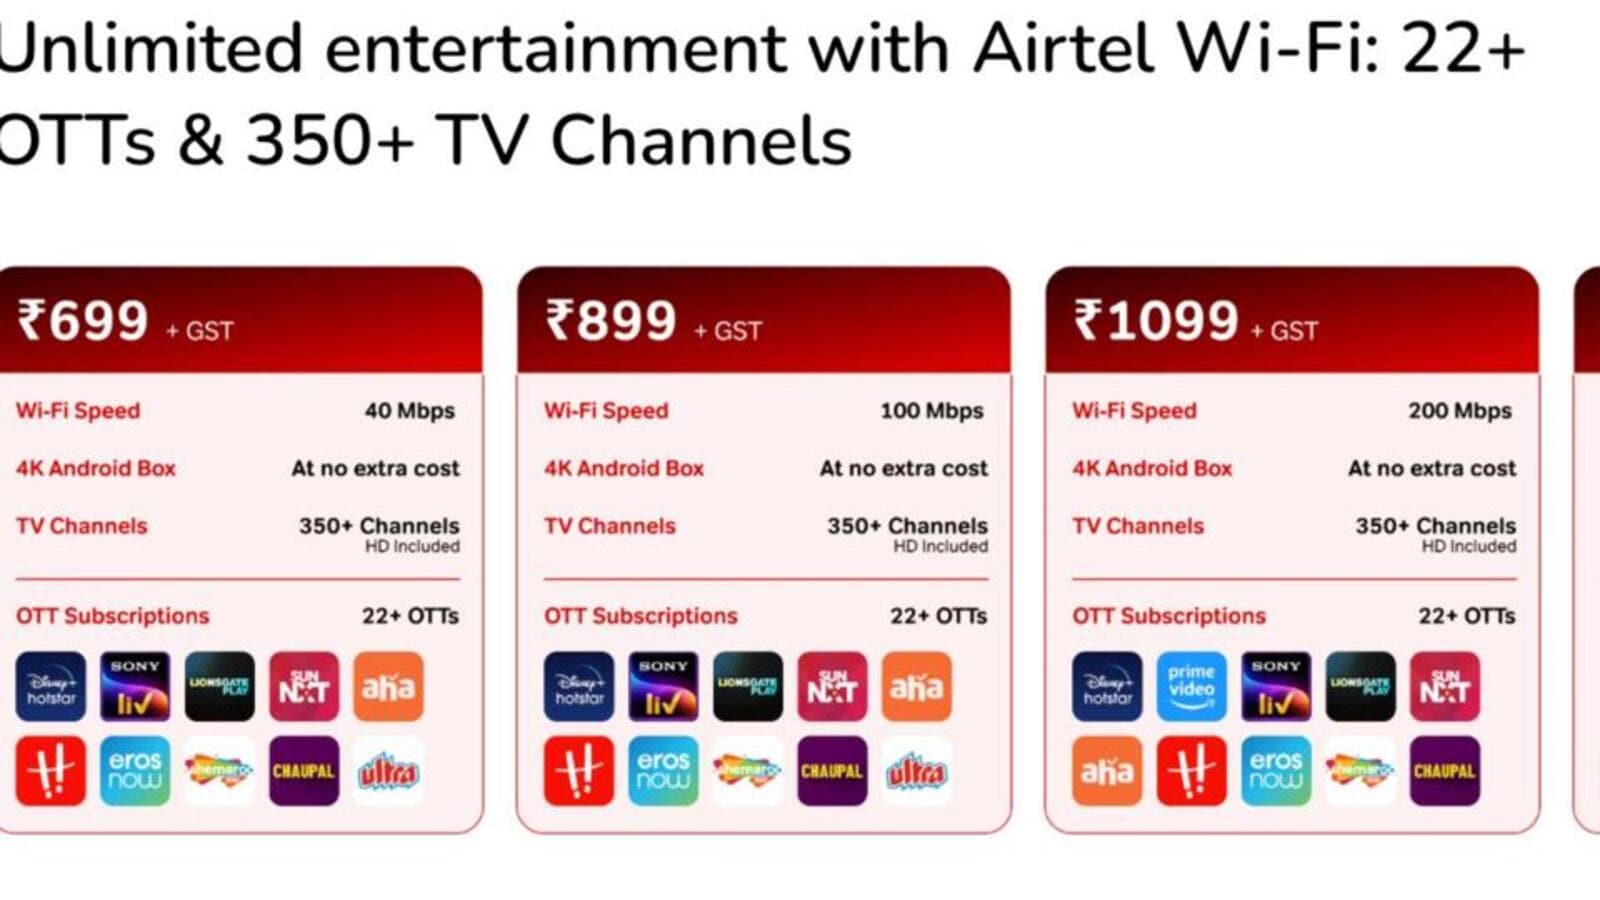
Latest news on July 11, 2024: Airtel says its new Xstream Fiber plans bundle over 350 live TV channels (Official Photo) (Reuters) Disclaimer: This is an AI-generated live blog and has not been edited by Hindustan Times staff.
Follow all the updates here:
-
Thu, 11 Jul 2024 08:44 PM
Business News LIVE Updates: Decoding Airtel’s new Xstream Fiber packages, finding value with Live TV and OTT
- Airtel confirms to HT that the live TV proposition is being delivered using its DTH network, while the bundled streaming subscriptions are an extension of its Xstream Play platform.
-
Thu, 11 Jul 2024 03:58 PM
Business News LIVE Updates: TCS Q1 results meet estimates: Net profit up 9%, ₹10 dividend declared
- TCS’s consolidated revenue rose 5.4% to Rs 626.13 billion in the June quarter. Analysts had expected revenue of Rs 622.07 billion, as per LSEG data.
-
Thu, 11 Jul 2024 03:51 PM
Business News LIVE Updates: Indian companies falsified generic Viagra data to get approval, says US FDA: Report
- Synapse Labs Pvt. Ltd may have been used in hundreds of drugs that are still available for sale, the report said.
-
Thu, 11 Jul 2024 03:09 PM
LIVE Business News Updates: Namita Thapar’s emotional post on Emcure IPO listing: ‘Mirza Ghalib sums up my feelings’
- Emcure Pharmaceuticals was listed at ₹1,325.05, up 31.45% on the BSE and NSE on July 10.
-
Thu, 11 Jul 2024 02:39 PM
LIVE business news updates: Amazon could face investigation over treatment of UK food suppliers, watchdog says
- An Amazon spokesperson said the company has made several improvements for food suppliers since last year’s results.
-
Thu, 11 Jul 2024 01:39 PM
LIVE Business News Updates: This Bengaluru company aims to launch a ‘space habitat’ by 2027, in talks with SpaceX
- AkashaLabdhi calls itself a “home among the stars” as it says the company’s area of expertise is signal processing and continuous automation.
-
Thu, 11 Jul 2024 01:10 PM
Business News LIVE Updates: Amazon India employees on working conditions: Made to stand for hours, bathroom breaks not allowed
- A survey conducted by UNI Global Union with the Amazon India Workers Association had 1,838 participants who alleged appalling working conditions at Amazon facilities in India.
-
Thu, 11 Jul 2024 12:44 PM
LIVE Business News Updates: UK overhauls listing rules in bid to attract IPOs to London: What has changed?
- The new rules allow companies to carry out more activities without putting them to a shareholder vote, the UK’s Financial Conduct Authority said.
-
Thu, 11 Jul 2024 12:18 PM
Business News LIVE Updates: Want to send money abroad? Open foreign currency accounts at GIFT City
- Foreign currency accounts will be like a bank account in India, but instead of rupees, you hold foreign currency like US dollars.
-
Thu, 11 Jul 2024 11:30 AM
Business News LIVE Updates: First Abu Dhabi Bank denies interest in acquiring stake in Yes Bank: Report
- The report said the Yes Bank stake sale has attracted interest from Japan, including Mitsubishi UFJ Financial Group Inc. and Sumitomo Mitsui Financial Group Inc.
-
Thu, 11 Jul 2024 11:04 AM
LIVE Business News Updates: TCS Share Price Surges Ahead of Q1 Results: What Brokers Say About the Stock
- TCS Share Price: The stock opened at ₹3,944.65 against its previous close of ₹3,909.90. It then rose 1.8 percent to ₹3,979.90 level.
-
Thu, 11 Jul 2024 10:22 AM
LIVE Business News Updates: Reliance Jio IPO listing likely in 2025 at $112 billion valuation: Jefferies
- Jio “could list at a valuation of $112 billion” and add “7-15 percent upside” to Reliance Industries’ share price, Jefferies said.
-
Thu, 11 Jul 2024 09:42 AM
LIVE Business News Updates: Yes Bank shares rise after Moody’s revises outlook to ‘positive’ from ‘stable’
- Global rating agency Moody’s has raised its outlook on Yes Bank to positive from “stable” despite expectations of a gradual improvement in its depositor base.
-
Thu, 11 Jul 2024 09:16 AM
Business News LIVE Updates: Sahaj Solar IPO opens today: All you need to know before subscribing to the issue
- Sahaj Solar IPO: The block issue aims to raise ₹52.56 crore through issuance of 2.92 million new shares and will close on July 15.
-
Thu, 11 Jul 2024 08:40 AM
LIVE Business News Updates: Why Analysts Believe India’s Earnings Season May Disappoint Stock Market Investors
- Investors in Indian stocks hoping for a robust earnings season to justify expensive valuations are likely to be disappointed.
-
Thu, 11 Jul 2024 08:35 AM
LIVE Business News Updates: Elon Musk Says Second Neuralink Brain Implant Will ‘Give People Superpowers’ Within a Week
- Elon Musk said Neuralink will make some changes to try to alleviate the problem of its electrode wires retracting from brain tissue.
-
Thu, 11 Jul 2024 07:59 AM
LIVE Business News Updates: Apple warns Indian iPhone users of possible Pegasus-like ‘spyware attack’
- In April this year, the Indian Computer Emergency Response Team (Cert-In) flagged several vulnerabilities in Apple’s operating system for iPhone and iPad.
-
Thu, 11 Jul 2024 07:45 AM
Business News LIVE Updates: US stock markets at record highs led by world’s biggest tech companies
- The Philadelphia Semiconductor Index rose 2.4% to a record high after Taiwan Semiconductor Manufacturing Co. reported strong quarterly revenue.
{{^userSubscribed}} {{/userSubscribed}} {{^userSubscribed}} {{/userSubscribed}}
{{^userSubscribed}} {{/userSubscribed}} {{^userSubscribed}} {{/userSubscribed}}
{{^userSubscribed}} {{/userSubscribed}} {{^userSubscribed}} {{/userSubscribed}}
{{^userSubscribed}} {{/userSubscribed}} {{^userSubscribed}} {{/userSubscribed}}
{{^userSubscribed}} {{/userSubscribed}} {{^userSubscribed}} {{/userSubscribed}}
{{^userSubscribed}} {{/userSubscribed}} {{^userSubscribed}} {{/userSubscribed}}
News / Business / Latest Business News Live Updates Today, July 11, 2024
Source
News
Jio Financial share price: Should you buy this Reliance group stock on Monday ahead of Q1 FY2024 results?

Q1 2024 Results: Jio Financial Share Price will be in focus on Monday as the Reliance Group company has a fixed board meeting on July 15, 2024 to consider and approve the company’s unaudited standalone and consolidated financial results. Trust Group company informed about the Q1 2024 Results date on Wednesday last week via an exchange filing. According to stock market experts, Jio Financial Services Limited is poised to deliver impressive Q1 results for FY25 on solid operating income. They have forecast a healthy QoQ PAT for the company in Q1 FY25.
Jio Financial Services News
Speaking on the Jio Financial Services Q1 2024 results, Manish Chowdhury, Head of Research, StoxBox, said, “We believe Jio Financial Services is poised to deliver impressive results in Q1FY25 aided by its operating income, which is likely to show robust growth driven by strong investment income, which in turn should lead to healthy PAT growth on a sequential basis. Jio Financial Services continues to make strategic moves such as launching digital products and expanding its ecosystem, with a clear focus on future growth. The company has announced plans to introduce products for lending against stocks and mutual funds, leveraging Jio’s large user base, which could be a significant growth driver in the coming quarters.”
“Furthermore, with the NBFC receiving RBI approval to become a primary investment company, Jio Financial Services is well-positioned to unlock value from its investments. Overall, we expect the company to report robust numbers in the upcoming quarter,” the StoxBox expert added.
Jio Financial Stock Target Price
Speaking about the technical outlook of Jio Financial share price, Ganesh Dongre, Senior Manager, Technical Research at Anand Rathi, said, “Jio Financial Services share price is poised to make a fresh high at the ₹260 apiece level. If the stock breaks above this mark, the Reliance Group stock could make a fresh high by touching the ₹290-₹295 zone. Hence, those with Jio Finance stock in their portfolio are advised to stick to the script by keeping a stop loss at ₹205. If the stock breaks above ₹260 decisively, then one can upgrade the stop loss at ₹240 for the near-term target of ₹295.”
On the advice to new buyers regarding Jio Financial stock, Ganesh Dongre said, “New buyers are advised to wait for the breakout. Once the stock breaks above ₹260, one can buy this Reliance Group stock at the short term target of ₹295, keeping a stop loss of ₹240 apiece.”
Disclaimer: The views and recommendations made above are those of individual analysts or brokerage firms, and not of Mint. Investors are advised to consult with certified experts before making any investment decisions.
3.6 Crore Indians visited in a single day choosing us as India’s undisputed platform for General Election Results. Explore Latest Updates here!
Topics that may interest you

“The cycle has just taken a huge turning point! October will be huge” – Lyn Alden

WARNING! The curse of Bitcoin August is about to hit again – James Lavish

Raoul Pal was right: the Fed is about to enhance Crypto – Catie Wood

“Only alone I will overload Bitcoin in a supercycle” – Michael Saylor

“Warning! Prepare for a sharp pullback this August before this happens” – Tom Lee and Raoul Pal

Switchboard Revolutionizes DeFi with New Oracle Aggregator

Latest Business News Live Updates Today, July 11, 2024

Is Zypto Wallet a Reliable Choice for DeFi Users?

👀 Lido prepares its response to the recovery boom

FinTech LIVE New York: Mastercard and the Power of Partnership
“The cycle has just taken a huge turning point! October will be huge” – Lyn Alden
WARNING! The curse of Bitcoin August is about to hit again – James Lavish
Raoul Pal was right: the Fed is about to enhance Crypto – Catie Wood
“Only alone I will overload Bitcoin in a supercycle” – Michael Saylor
“Warning! Prepare for a sharp pullback this August before this happens” – Tom Lee and Raoul Pal
-
 DeFi1 year ago
Switchboard Revolutionizes DeFi with New Oracle Aggregator
-
 News1 year ago
Latest Business News Live Updates Today, July 11, 2024
-
 DeFi1 year ago
Is Zypto Wallet a Reliable Choice for DeFi Users?
-
 DeFi1 year ago
👀 Lido prepares its response to the recovery boom
-
 Fintech1 year ago
FinTech LIVE New York: Mastercard and the Power of Partnership
-

 DeFi1 year ago
Ethena downplays danger of letting traders use USDe to back risky bets – DL News
-

 Fintech1 year ago
121 Top Fintech Companies & Startups To Know In 2024
-

 ETFs1 year ago
Gold ETFs see first outing after March 2023 at ₹396 cr on profit booking
-

 DeFi1 year ago
TON Network Surpasses $200M TVL, Boosted by Open League and DeFi Growth ⋆ ZyCrypto
-

 Fintech1 year ago
Fintech unicorn Zeta launches credit as a UPI-linked service for banks
-

 ETFs1 year ago
Largest US Bank Invests in Spot BTC ETFs While Dimon Remains a Bitcoin Hater ⋆ ZyCrypto
-

 ETFs1 year ago
Solana ETF Could Push SOL Price to $1,300, Threatening Ether Market Position ⋆ ZyCrypto