News
Medtronic reports full year and fourth quarter fiscal 2024 financial results; announces dividend increase

Broad-based, durable growth across the company, including Cranial & Spinal Technologies, Diabetes, Cardiac Pacing, Surgical, and Structural Heart; gaining momentum as company enters new product cycles across many high-growth markets
DUBLIN, May 23, 2024 /PRNewswire/ — Medtronic plc (NYSE:MDT) today announced financial results for its fourth quarter (Q4) and fiscal year 2024 (FY24), which ended April 26, 2024.
Key Highlights
- Q4 revenue of $8.6 billion increased 0.5% as reported and 5.4% organic
- Q4 GAAP diluted earnings per share (EPS) of $0.49; non-GAAP diluted EPS of $1.46
- FY24 revenue of $32.4 billion increased 3.6% as reported and 5.2% organic
- FY24 GAAP diluted EPS of $2.76; non-GAAP diluted EPS of $5.20
- FY24 cash from operations of $6.8 billion increased 12%; FY24 free cash flow of $5.2 billion increased 14%
- Company returned $5.5 billion to shareholders in FY24, including $1.6 billion through net share repurchases in Q4
- Company issues FY25 guidance
- Dividend increased to $0.70 per share quarterly, annual $2.80 per share; 47th consecutive year of dividend increases
- Received U.S. FDA approval for Evolut™ FX+ TAVR system and Inceptiv™ closed-loop spinal cord stimulator; received China National Medical Products Administration (NMPA) approval for Symplicity Spyral™ renal denervation system; submitted Affera Sphere-9™ ablation catheter and Simplera Sync™ CGM to U.S. FDA seeking approval
Q4 Financial Results
Medtronic reported Q4 worldwide revenue of $8.589 billion, an increase of 0.5% as reported and 5.4% on an organic basis. The company’s organic revenue results reflect broad-based growth across the company, with mid-single digit or higher organic revenue growth in all four segments. The organic revenue growth comparison excludes:
- $57 million of current year revenue and $114 million of prior year revenue reported as Other, stemming from business separations and product line exits;
- $72 million of unfavorable impact from foreign currency translation on the remaining segments; and
- $265 million of prior year revenue from a one-time intellectual property (IP) agreement, which was reported in the Structural Heart & Aortic division in the Cardiovascular Portfolio
As reported, Q4 GAAP net income and diluted EPS were $654 million and $0.49, respectively, decreases of 45% and 44%, respectively. As detailed in the financial schedules included at the end of this release, Q4 non-GAAP net income and non-GAAP diluted EPS were $1.929 billion and $1.46, respectively, decreases of 8% and 7%, respectively. Included in Q4 non-GAAP diluted EPS was a 7 cent, or 4%, unfavorable impact from foreign currency translation.
FY24 Financial Results
Medtronic reported FY24 worldwide revenue of $32.364 billion, an increase of 3.6% as reported and 5.2% on an organic basis. The FY24 organic revenue growth comparison excludes:
- $111 million of current year revenue and $358 million of prior year revenue reported as Other, stemming from business separations and product line exits;
- $43 million of favorable impact from foreign currency translation on the remaining segments; and
- $265 million of prior year revenue from a one-time IP agreement.
FY24 GAAP net income and diluted earnings per share (EPS) were $3.676 billion and $2.76, respectively, both representing decreases of 2%. As detailed in the financial schedules included at the end of this release, fiscal year 2024 non-GAAP net income and non-GAAP diluted EPS were $6.918 billion and $5.20, respectively, both representing decreases of 2%. Included in FY24 non-GAAP diluted EPS was a 33 cent unfavorable impact from foreign currency translation. FY24 non-GAAP diluted EPS on a constant currency basis increased 5%.
FY24 cash from operations of $6.787 billion increased 12%. FY24 free cash flow of $5.200 billion increased 14%, representing free cash flow conversion from non-GAAP net earnings of 75%. Growth was driven by improvements in working capital.
“We delivered a strong finish to the fiscal year, with broad strength across our businesses and each of our four segments posting mid-single digit or higher organic revenue growth,” said Geoff Martha, Medtronic chairman and chief executive officer. “Our momentum is building into the new fiscal year. We’re beginning new product cycles in some of MedTech’s most attractive markets, which is further enhanced as we apply AI across our portfolio. We are very optimistic about what we can achieve in fiscal ’25 and beyond.”
Cardiovascular Portfolio
The Cardiovascular Portfolio includes the Cardiac Rhythm & Heart Failure (CRHF), Structural Heart & Aortic (SHA), and Coronary & Peripheral Vascular (CPV) divisions. FY24 revenue of $11.831 billion increased 2.7% as reported and 5.0% organic, with a high-single digit increase in SHA, mid-single digit increase in CPV, and a low-single digit increase in CRHF, all on an organic basis. Q4 revenue of $3.130 billion decreased 5.2% as reported and increased 4.0% organic, with mid-single digit organic increases in SHA and CPV, and a low-single digit organic increase in CRHF.
- CRHF Q4 results included low-single digit growth in Cardiac Rhythm Management, driven by high-single digit growth in Cardiac Pacing Therapies, including low-20s growth in Micra™ transcatheter pacing systems; Cardiac Ablation Solutions grew mid-single digits, with declines in cryoablation more than offset by strong growth in pulsed field ablation (PFA)
- SHA Q4 results driven by high-single digit growth in Structural Heart and Cardiac Surgery; Structural Heart had double digit growth in Western Europe and Japan on the continued adoption of the Evolut™ FX transcatheter aortic valve replacement (TAVR) system
- CPV in Q4 delivered mid-single digit Coronary growth with strength in guide catheters and balloons; Peripheral Vascular Health also grew mid-single digits, with mid-teens growth in drug-coated balloons and vascular embolization products
- Received U.S. FDA approval for Evolut™ FX+ TAVR system in March, with early commercial experience this spring 2024 and full product launch in summer 2024; Launched Avalus Ultra™ surgical aortic tissue value in the U.S.; Symplicity Spyral™ renal denervation system received National Medical Products Administration (NMPA) approval in China and license from Health Canada
- One-year results from SMART trial simultaneously presented at American College of Cardiology and published in The New England Journal of Medicine in April, demonstrating Medtronic Evolut™ TAVR platform as optimal treatment for severe aortic stenosis in patients with small annuli, which is primarily women
- First-in-human data studying the Sphere-360™ PFA catheter presented at European Heart Rhythm Association annual meeting in April; one-year results from SPHERE-PER AF pivotal study of the Sphere-9™ pulsed field (PF) and radiofrequency (RF) ablation, and high density (HD) mapping catheter with the Affera cardiac mapping and navigation platform presented at Heart Rhythm last week, system has been submitted to U.S. FDA seeking approval
Neuroscience Portfolio
The Neuroscience Portfolio includes the Cranial & Spinal Technologies (CST), Specialty Therapies, and Neuromodulation divisions. FY24 revenue of $9.406 billion increased 5.0% as reported and 5.2% organic, with a high-single digit increase in CST, mid-single digit increase in Specialty Therapies, and a low-single digit increase in Neuromodulation, all on an organic basis. Q4 revenue of $2.545 billion increased 5.6% as reported and 6.5% organic, with a high-single digit increase in CST, a mid-single digit increase in Neuromodulation, and low-single digit increase in Specialty Therapies, all on an organic basis.
- CST Q4 performance driven by continued adoption of the AiBLE™ ecosystem, with mid-teens growth in Neurosurgery on strong capital equipment sales, high-single digit growth in Biologics, and mid-single digit growth in Core Spine
- Specialty Therapies Q4 results driven by high-single digit growth in ENT, with strength in power capital and disposables and localized drug delivery sinus implants; Neurovascular declined low-single digits, as declines in China due to volume-based procurement tenders offset strength in flow diversion products; Pelvic Health increased mid-single digits on continued adoption of the InterStim X™ system
- Neuromodulation in Q4 delivered low-double digit growth in Brain Modulation on the launch of the Percept™ RC neurostimulator with BrainSense™ technology; Pain Therapies grew mid-single digits, including low-double digit growth in Targeted Drug Delivery and low-single digit growth in Pain Stim
- Received U.S. FDA approval for Inceptiv™ closed-loop spinal cord stimulator on last day of Q4; received U.S. FDA clearance for OsteoCool™ 2.0 bone tumor ablation system in Q4, with broad market launch planned later this calendar year
Medical Surgical Portfolio
The Medical Surgical Portfolio includes the Surgical & Endoscopy (SE) and the Acute Care & Monitoring (ACM) divisions. FY24 revenue of $8.417 billion increased 5.4% as reported and 4.7% organic, with a mid-single digit increase in SE and low-single digit increase in ACM, both on an organic basis. Q4 revenue of $2.198 billion increased 3.5% as reported and 4.5% organic, with mid-single digit organic growth in SE and low-single digit organic growth in ACM.
- SE Q4 results included high-single digit growth in General Surgical Technologies, with strength in wound management and hernia products, low-single digit growth in Advanced Surgical Technologies, and high-single digit growth in Endoscopy on strength of capital sales
- ACM Q4 performance driven by mid-single digit growth in Blood Oxygen Management on strong sales of Nellcor™ pulse oximetry products, and mid-single digit growth in Airways, driven by strong McGRATH™ MAC video laryngoscope demand
- Launched Touch Surgery™ Live Stream and 14 new AI-driven algorithms on the Touch Surgery™ Performance Insights platform for laparoscopic and robotic-assisted procedures; received U.S. FDA clearance for the BIS™ Advance anesthesia monitor; started enrollment in two new U.S. indication studies for the Hugo™ robotic-assisted surgery system: Hernia and Gynecology
Diabetes
Diabetes FY24 revenue of $2.488 billion increased 10.0% as reported and 8.6% organic. Q4 revenue of $660 million increased 10.9% as reported and 11.1% organic.
- U.S. Q4 revenue grew low-double digits on the continued launch of the MiniMed™ 780G system; high-forties growth in U.S. insulin pump sales with strong growth in sales to new patients
- Non-U.S. Developed Markets grew high-single digits on continued MiniMed™ 780G system adoption and increased CGM attachment rates
- Submitted Simplera Sync™ CGM to U.S. FDA in Q4 seeking approval for use with the MiniMed™ 780G system
Guidance
The company today issued its fiscal year 2025 (FY25) revenue growth and EPS guidance.
The company is guiding to FY25 organic revenue growth in the range of 4% to 5%. The organic revenue growth guidance excludes the impact of foreign currency exchange and revenue reported as Other. Including Other revenue and the impact of foreign currency exchange, if recent foreign currency exchange rates hold, FY25 revenue growth on a reported basis would be in the range of 2.4% to 3.7%.
The company is guiding to FY25 diluted non-GAAP EPS in the range of $5.40 to $5.50, including an estimated 5% unfavorable impact from foreign currency exchange based on recent rates. This would represent FY25 diluted non-GAAP EPS growth in the range of 4 to 6%.
Dividend Increase
The company today announced that effective May 22, 2024, the Medtronic board of directors approved an increase in Medtronic’s cash dividend for the first quarter of fiscal year 2025, raising the quarterly amount to $0.70 per ordinary share. This would translate into an annual amount of $2.80 per ordinary share. Medtronic has a long history of dividend growth, and the company is a constituent of the S&P 500 Dividend Aristocrats index. Today’s announcement marks the 47th consecutive year of an increase in the dividend payment. Including today’s increase, Medtronic’s dividend per share has grown by 30% over the past 5 years, 130% over the past 10 years, and has grown at a 16% compounded annual growth rate over the past 47 years.
Medtronic has a strong track record of returning capital to its shareholders, including $5.5 billion in fiscal year 2024. The company remains committed to returning a minimum of 50% of its free cash flow to shareholders, primarily through dividends, and to a lesser extent, share repurchases. The dividend is payable on July 12, 2024, to shareholders of record at the close of business on June 28, 2024.
“We delivered on our commitments in the fourth quarter and the fiscal year, driving durable revenue growth, improved earnings power, and strong free cash flow,” said Karen Parkhill, Medtronic EVP & chief financial officer. “Our fiscal 2025 guidance, along with our dividend increase and recent share repurchase, reflects our confidence in our continued trajectory.”
Video Webcast Information
Medtronic will host a video webcast today, May 23, at 8:00 a.m. EDT (7:00 a.m. CDT) to provide information about its businesses for the public, investors, analysts, and news media. This webcast can be accessed by clicking on the Events icon at investorrelations.medtronic.com, and this earnings release will be archived at news.medtronic.com. Within 24 hours of the webcast, a replay of the webcast and transcript of the company’s prepared remarks will be available by clicking on the Events icon at investorrelations.medtronic.com.
Medtronic plans to report its FY25 first, second, third, and fourth quarter results on Tuesday, August 20, 2024, November 19, 2024, February 18, 2025, and Thursday, May 22, 2025, respectively. Confirmation and additional details will be provided closer to the specific event.
Financial Schedules and Earnings Presentation
The fourth quarter financial schedules and non-GAAP reconciliations can be viewed by clicking on the Investor Events link at investorrelations.medtronic.com. To view a printable PDF of the financial schedules and non-GAAP reconciliations, click here. To view the fourth quarter earnings presentation, click here.
|
MEDTRONIC PLC
WORLD WIDE REVENUE(1)
(Unaudited)
|
||||||||||||||||||||||||||||
|
FOURTH QUARTER
|
FISCAL YEAR
|
|||||||||||||||||||||||||||
|
REPORTED
|
ORGANIC
|
REPORTED
|
ORGANIC
|
|||||||||||||||||||||||||
|
(in millions)
|
FY24
|
FY23
|
Growth
|
Currency
|
Adjusted
|
Adjusted
|
Adjusted
|
FY24
|
FY23
|
Growth
|
Currency
|
Adjusted
|
Adjusted
|
Adjusted
|
||||||||||||||
|
Cardiovascular
|
$ 3,130
|
$ 3,302
|
(5.2) %
|
$ (28)
|
$ 3,158
|
$ 3,037
|
4.0 %
|
$ 11,831
|
$ 11,522
|
2.7 %
|
$ 12
|
$ 11,819
|
$ 11,257
|
5.0 %
|
||||||||||||||
|
Cardiac Rhythm & Heart Failure
|
1,587
|
1,567
|
1.3
|
(15)
|
1,602
|
1,567
|
2.2
|
5,995
|
5,783
|
3.7
|
11
|
5,984
|
5,783
|
3.5
|
||||||||||||||
|
Structural Heart & Aortic
|
883
|
1,105
|
(20.1)
|
(6)
|
889
|
840
|
5.8
|
3,358
|
3,363
|
(0.1)
|
11
|
3,347
|
3,098
|
8.0
|
||||||||||||||
|
Coronary & Peripheral Vascular
|
660
|
631
|
4.6
|
(7)
|
667
|
631
|
5.7
|
2,478
|
2,375
|
4.3
|
(10)
|
2,488
|
2,375
|
4.8
|
||||||||||||||
|
Neuroscience
|
2,545
|
2,410
|
5.6
|
(21)
|
2,566
|
2,410
|
6.5
|
9,406
|
8,959
|
5.0
|
(16)
|
9,422
|
8,959
|
5.2
|
||||||||||||||
|
Cranial & Spinal Technologies
|
1,291
|
1,198
|
7.8
|
(11)
|
1,302
|
1,198
|
8.7
|
4,756
|
4,451
|
6.9
|
(11)
|
4,767
|
4,451
|
7.1
|
||||||||||||||
|
Specialty Therapies
|
778
|
763
|
2.0
|
(9)
|
787
|
763
|
3.1
|
2,905
|
2,815
|
3.2
|
(12)
|
2,917
|
2,815
|
3.6
|
||||||||||||||
|
Neuromodulation
|
475
|
449
|
5.8
|
(1)
|
476
|
449
|
6.0
|
1,746
|
1,693
|
3.1
|
7
|
1,739
|
1,693
|
2.7
|
||||||||||||||
|
Medical Surgical
|
2,198
|
2,124
|
3.5
|
(22)
|
2,220
|
2,124
|
4.5
|
8,417
|
7,989
|
5.4
|
16
|
8,512
|
8,127
|
4.7
|
||||||||||||||
|
Surgical & Endoscopy
|
1,705
|
1,638
|
4.1
|
(15)
|
1,720
|
1,638
|
5.0
|
6,508
|
6,152
|
5.8
|
20
|
6,488
|
6,152
|
5.5
|
||||||||||||||
|
Acute Care & Monitoring
|
492
|
486
|
1.2
|
(6)
|
498
|
486
|
2.5
|
1,908
|
1,837
|
3.9
|
(4)
|
2,024
|
1,975
|
2.5
|
||||||||||||||
|
Diabetes
|
660
|
595
|
10.9
|
(1)
|
661
|
595
|
11.1
|
2,488
|
2,262
|
10.0
|
31
|
2,457
|
2,262
|
8.6
|
||||||||||||||
|
Other (2)
|
57
|
114
|
(50.0)
|
(3)
|
—
|
—
|
—
|
221
|
495
|
(55.4)
|
(12)
|
—
|
—
|
—
|
||||||||||||||
|
TOTAL
|
$ 8,589
|
$ 8,544
|
0.5 %
|
$ (75)
|
$ 8,604
|
$ 8,165
|
5.4 %
|
$ 32,364
|
$ 31,227
|
3.6 %
|
$ 31
|
$ 32,210
|
$ 30,604
|
5.2 %
|
||||||||||||||
|
(1)
|
The data in this schedule has been intentionally rounded to the nearest million and, therefore, may not sum.
|
|
(2)
|
Includes historical operations and ongoing transition agreements from businesses the Company has exited or divested, which primarily includes the Company’s ventilator product line and the Renal Care Solutions (RCS) business.
|
|
(3)
|
The currency impact to revenue measures the change in revenue between current and prior year periods using constant exchange rates.
|
|
(4)
|
The three and twelve months ended April 26, 2024 excludes $57 million and $111 million, respectively, of inorganic revenue related to the activity noted in (2) and $72 million of unfavorable currency impact and $43 million of favorable currency impact on the remaining segments, respectively. The fiscal year organic revenue calculation reclassifies the first nine months of ventilator product line revenue of $110 million from the Other line to the Acute Care and Monitoring division of the Medical Surgical Portfolio.
|
|
(5)
|
The three and twelve months ended April 28, 2023 excludes $379 million and $623 million, respectively, of inorganic revenue related to the following:
|
|
• $265 million related to the one-time payment received as a result of the Intellectual Property Agreement entered into with Edwards Lifesciences in April 2023, which is included in the reported results of the Structural Heart & Aortic division of the Cardiovascular portfolio, and
|
|
|
• $114 million and $358 million, respectively, of inorganic revenue related to the activity noted in (2). The fiscal year organic revenue calculation reclassifies the first nine months of ventilator product line revenue of $138 million from the Other line to the Acute Care and Monitoring division of the Medical Surgical Portfolio.
|
|
MEDTRONIC PLC
U.S.(1)(2) REVENUE
(Unaudited)
|
||||||||||||||||||||||||
|
FOURTH QUARTER
|
FISCAL YEAR
|
|||||||||||||||||||||||
|
REPORTED
|
ORGANIC
|
REPORTED
|
ORGANIC
|
|||||||||||||||||||||
|
(in millions)
|
FY24
|
FY23
|
Growth
|
Adjusted
|
Adjusted
|
Growth
|
FY24
|
FY23
|
Growth
|
Adjusted
|
Adjusted
|
Growth
|
||||||||||||
|
Cardiovascular
|
$ 1,448
|
$ 1,737
|
(16.6) %
|
$ 1,448
|
$ 1,472
|
(1.6) %
|
$ 5,597
|
$ 5,796
|
(3.4) %
|
$ 5,597
|
$ 5,531
|
1.2 %
|
||||||||||||
|
Cardiac Rhythm & Heart Failure
|
791
|
819
|
(3.4)
|
791
|
819
|
(3.4)
|
3,037
|
3,052
|
(0.5)
|
3,037
|
3,052
|
(0.5)
|
||||||||||||
|
Structural Heart & Aortic
|
366
|
625
|
(41.4)
|
366
|
360
|
1.7
|
1,453
|
1,622
|
(10.4)
|
1,453
|
1,357
|
7.1
|
||||||||||||
|
Coronary & Peripheral Vascular
|
291
|
293
|
(0.7)
|
291
|
293
|
(0.7)
|
1,107
|
1,122
|
(1.3)
|
1,107
|
1,122
|
(1.3)
|
||||||||||||
|
Neuroscience
|
1,692
|
1,581
|
7.0
|
1,692
|
1,581
|
7.0
|
6,305
|
6,018
|
4.8
|
6,305
|
6,018
|
4.8
|
||||||||||||
|
Cranial & Spinal Technologies
|
936
|
855
|
9.5
|
936
|
855
|
9.5
|
3,495
|
3,259
|
7.2
|
3,495
|
3,259
|
7.2
|
||||||||||||
|
Specialty Therapies
|
439
|
422
|
4.0
|
439
|
422
|
4.0
|
1,641
|
1,608
|
2.1
|
1,641
|
1,608
|
2.1
|
||||||||||||
|
Neuromodulation
|
317
|
304
|
4.3
|
317
|
304
|
4.3
|
1,169
|
1,151
|
1.6
|
1,169
|
1,151
|
1.6
|
||||||||||||
|
Medical Surgical
|
954
|
919
|
3.8
|
954
|
919
|
3.8
|
3,717
|
3,549
|
4.7
|
3,759
|
3,604
|
4.3
|
||||||||||||
|
Surgical & Endoscopy
|
679
|
653
|
4.0
|
679
|
653
|
4.0
|
2,650
|
2,541
|
4.3
|
2,650
|
2,541
|
4.3
|
||||||||||||
|
Acute Care & Monitoring
|
275
|
266
|
3.4
|
275
|
266
|
3.4
|
1,067
|
1,008
|
5.9
|
1,109
|
1,063
|
4.3
|
||||||||||||
|
Diabetes
|
223
|
199
|
12.1
|
223
|
199
|
12.1
|
852
|
849
|
0.4
|
852
|
849
|
0.4
|
||||||||||||
|
Other (3)
|
26
|
39
|
(33.3)
|
—
|
—
|
—
|
91
|
160
|
(43.1)
|
—
|
—
|
—
|
||||||||||||
|
TOTAL
|
$ 4,343
|
$ 4,476
|
(3.0) %
|
$ 4,317
|
$ 4,171
|
3.5 %
|
$ 16,562
|
$ 16,373
|
1.2 %
|
$ 16,514
|
$ 16,003
|
3.2 %
|
||||||||||||
|
(1)
|
U.S. includes the United States and U.S. territories.
|
|
(2)
|
The data in this schedule has been intentionally rounded to the nearest million and, therefore, may not sum.
|
|
(3)
|
Includes historical operations and ongoing transition agreements from businesses the Company has exited or divested, which primarily includes the Company’s ventilator product line and the Renal Care Solutions (RCS) business.
|
|
(4)
|
The three and twelve months ended April 26, 2024 excludes $26 million and $48 million, respectively, of inorganic revenue related to the activity noted in (3). The fiscal year organic revenue calculation reclassifies the first nine months of ventilator product line revenue of $42 million from the Other line to the Acute Care and Monitoring division of the Medical Surgical Portfolio.
|
|
(5)
|
The three and twelve months ended April 28, 2023 excludes $304 million and $370 million, respectively, of inorganic revenue related to the following:
|
|
• $265 million related to the one-time payment received as a result of the Intellectual Property Agreement entered into with Edwards Lifesciences in April 2023, which is included in the reported results of the Structural Heart & Aortic division of the Cardiovascular portfolio, and
|
|
|
• $39 million and $105 million, respectively, of inorganic revenue related to the activity noted in (3). The fiscal year organic revenue calculation reclassifies the first nine months of ventilator product line revenue of $55 million from the Other line to the Acute Care and Monitoring division of the Medical Surgical Portfolio.
|
|
MEDTRONIC PLC
WORLD WIDE REVENUE: GEOGRAPHIC (1)(2)
(Unaudited)
|
||||||||||||||||||||||||||||
|
FOURTH QUARTER
|
FISCAL YEAR
|
|||||||||||||||||||||||||||
|
REPORTED
|
ORGANIC
|
REPORTED
|
ORGANIC
|
|||||||||||||||||||||||||
|
(in millions)
|
FY24
|
FY23
|
Growth
|
Currency
|
Adjusted
|
Adjusted
|
Growth
|
FY24
|
FY23
|
Growth
|
Currency
|
Adjusted
|
Adjusted
|
Growth
|
||||||||||||||
|
U.S.
|
$ 1,448
|
$ 1,737
|
(16.6) %
|
$ —
|
$ 1,448
|
$ 1,472
|
(1.6) %
|
$ 5,597
|
$ 5,796
|
(3.4) %
|
$ —
|
$ 5,597
|
$ 5,531
|
1.2 %
|
||||||||||||||
|
Non-U.S. Developed
|
1,039
|
1,011
|
2.8
|
(13)
|
1,052
|
1,011
|
4.1
|
3,857
|
3,564
|
8.2
|
62
|
3,795
|
3,564
|
6.5
|
||||||||||||||
|
Emerging Markets
|
643
|
554
|
16.1
|
(15)
|
658
|
554
|
18.8
|
2,377
|
2,161
|
10.0
|
(49)
|
2,426
|
2,161
|
12.3
|
||||||||||||||
|
Cardiovascular
|
3,130
|
3,302
|
(5.2)
|
(28)
|
3,158
|
3,037
|
4.0
|
11,831
|
11,522
|
2.7
|
12
|
11,819
|
11,257
|
5.0
|
||||||||||||||
|
U.S.
|
1,692
|
1,581
|
7.0
|
—
|
1,692
|
1,581
|
7.0
|
6,305
|
6,018
|
4.8
|
—
|
6,305
|
6,018
|
4.8
|
||||||||||||||
|
Non-U.S. Developed
|
482
|
469
|
2.8
|
(11)
|
493
|
469
|
5.1
|
1,739
|
1,658
|
4.9
|
9
|
1,730
|
1,658
|
4.3
|
||||||||||||||
|
Emerging Markets
|
371
|
360
|
3.1
|
(10)
|
381
|
360
|
5.8
|
1,362
|
1,283
|
6.2
|
(25)
|
1,387
|
1,283
|
8.1
|
||||||||||||||
|
Neuroscience
|
2,545
|
2,410
|
5.6
|
(21)
|
2,566
|
2,410
|
6.5
|
9,406
|
8,959
|
5.0
|
(16)
|
9,422
|
8,959
|
5.2
|
||||||||||||||
|
U.S.
|
954
|
919
|
3.8
|
—
|
954
|
919
|
3.8
|
3,717
|
3,549
|
4.7
|
—
|
3,759
|
3,604
|
4.3
|
||||||||||||||
|
Non-U.S. Developed
|
805
|
799
|
0.8
|
(17)
|
822
|
799
|
2.9
|
3,049
|
2,917
|
4.5
|
20
|
3,055
|
2,944
|
3.8
|
||||||||||||||
|
Emerging Markets
|
439
|
405
|
8.4
|
(5)
|
444
|
405
|
9.6
|
1,650
|
1,522
|
8.4
|
(4)
|
1,697
|
1,579
|
7.5
|
||||||||||||||
|
Medical Surgical
|
2,198
|
2,124
|
3.5
|
(22)
|
2,220
|
2,124
|
4.5
|
8,417
|
7,989
|
5.4
|
16
|
8,512
|
8,127
|
4.7
|
||||||||||||||
|
U.S.
|
223
|
199
|
12.1
|
—
|
223
|
199
|
12.1
|
852
|
849
|
0.4
|
—
|
852
|
849
|
0.4
|
||||||||||||||
|
Non-U.S. Developed
|
337
|
314
|
7.3
|
1
|
336
|
314
|
7.0
|
1,284
|
1,106
|
16.1
|
37
|
1,247
|
1,106
|
12.7
|
||||||||||||||
|
Emerging Markets
|
99
|
82
|
20.7
|
(2)
|
101
|
82
|
23.2
|
352
|
307
|
14.7
|
(6)
|
358
|
307
|
16.6
|
||||||||||||||
|
Diabetes
|
660
|
595
|
10.9
|
(1)
|
661
|
595
|
11.1
|
2,488
|
2,262
|
10.0
|
31
|
2,457
|
2,262
|
8.6
|
||||||||||||||
|
U.S.
|
26
|
39
|
(33.3)
|
—
|
—
|
—
|
—
|
91
|
160
|
(43.1)
|
—
|
—
|
—
|
—
|
||||||||||||||
|
Non-U.S. Developed
|
11
|
35
|
(68.6)
|
(2)
|
—
|
—
|
—
|
50
|
163
|
(69.3)
|
(6)
|
—
|
—
|
—
|
||||||||||||||
|
Emerging Markets
|
21
|
39
|
(46.2)
|
(1)
|
—
|
—
|
—
|
81
|
172
|
(52.9)
|
(5)
|
—
|
—
|
—
|
||||||||||||||
|
Other (3)
|
57
|
114
|
(50.0)
|
(3)
|
—
|
—
|
—
|
221
|
495
|
(55.4)
|
(12)
|
—
|
—
|
—
|
||||||||||||||
|
U.S.
|
4,343
|
4,476
|
(3.0)
|
—
|
4,317
|
4,171
|
3.5
|
16,562
|
16,373
|
1.2
|
—
|
16,514
|
16,003
|
3.2
|
||||||||||||||
|
Non-U.S. Developed
|
2,674
|
2,629
|
1.7
|
(42)
|
2,702
|
2,593
|
4.2
|
9,979
|
9,408
|
6.1
|
121
|
9,828
|
9,272
|
6.0
|
||||||||||||||
|
Emerging Markets
|
1,572
|
1,440
|
9.2
|
(33)
|
1,584
|
1,401
|
13.1
|
5,823
|
5,446
|
6.9
|
(89)
|
5,869
|
5,330
|
10.1
|
||||||||||||||
|
TOTAL
|
$ 8,589
|
$ 8,544
|
0.5 %
|
$ (75)
|
$ 8,604
|
$ 8,165
|
5.4 %
|
$ 32,364
|
$ 31,227
|
3.6 %
|
$ 31
|
$ 32,210
|
$ 30,604
|
5.2 %
|
||||||||||||||
|
(1)
|
U.S. includes the United States and U.S. territories. Non-U.S. developed markets include Japan, Australia, New Zealand, Korea, Canada, and the countries of Western Europe. Emerging Markets include the countries of the Middle East, Africa, Latin America, Eastern Europe, and the countries of Asia that are not included in the non-U.S. developed markets, as previously defined.
|
|
(2)
|
The data in this schedule has been intentionally rounded to the nearest million and, therefore, may not sum.
|
|
(3)
|
Includes historical operations and ongoing transition agreements from businesses the Company has exited or divested, which primarily includes the Company’s ventilator product line and the Renal Care Solutions (RCS) business.
|
|
(4)
|
The currency impact to revenue measures the change in revenue between current and prior year periods using constant exchange rates.
|
|
(5)
|
The three and twelve months ended April 26, 2024 excludes $57 million and $111 million, respectively, of inorganic revenue related to the activity noted in (3) and $72 million of unfavorable currency impact and $43 million of favorable currency impact on the remaining segments, respectively. The fiscal year organic revenue calculation reclassifies the first nine months of ventilator product line revenue of $110 million from the Other line to the Acute Care and Monitoring division of the Medical Surgical Portfolio.
|
|
(6)
|
The three and twelve months ended April 28, 2023 excludes $379 million and $623 million, respectively, of inorganic revenue related to the following:
|
|
• $265 million related to the one-time payment received as a result of the Intellectual Property Agreement entered into with Edwards Lifesciences in April 2023, which is included in the reported results of the Structural Heart & Aortic division of the Cardiovascular portfolio, and
|
|
|
• $114 million and $358 million, respectively, of inorganic revenue related to the activity noted in (3). The fiscal year organic revenue calculation reclassifies the first nine months of ventilator product line revenue of $138 million from the Other line to the Acute Care and Monitoring division of the Medical Surgical Portfolio.
|
|
MEDTRONIC PLC
CONSOLIDATED STATEMENTS OF INCOME
(Unaudited)
|
|||||||
|
Three months ended
|
Fiscal year ended
|
||||||
|
(in millions, except per share data)
|
April 26, 2024
|
April 28, 2023
|
April 26, 2024
|
April 28, 2023
|
|||
|
Net sales
|
$ 8,589
|
$ 8,544
|
$ 32,364
|
$ 31,227
|
|||
|
Costs and expenses:
|
|||||||
|
Cost of products sold, excluding amortization of intangible assets
|
3,044
|
2,980
|
11,216
|
10,719
|
|||
|
Research and development expense
|
675
|
640
|
2,735
|
2,696
|
|||
|
Selling, general, and administrative expense
|
2,765
|
2,616
|
10,736
|
10,415
|
|||
|
Amortization of intangible assets
|
419
|
423
|
1,693
|
1,698
|
|||
|
Restructuring charges, net
|
112
|
294
|
226
|
375
|
|||
|
Certain litigation charges, net
|
44
|
(30)
|
149
|
(30)
|
|||
|
Other operating expense (income), net
|
477
|
56
|
464
|
(131)
|
|||
|
Operating profit
|
1,053
|
1,565
|
5,144
|
5,485
|
|||
|
Other non-operating income, net
|
(4)
|
(173)
|
(412)
|
(515)
|
|||
|
Interest expense, net
|
202
|
187
|
719
|
636
|
|||
|
Income before income taxes
|
856
|
1,551
|
4,837
|
5,364
|
|||
|
Income tax provision
|
196
|
362
|
1,133
|
1,580
|
|||
|
Net income
|
659
|
1,188
|
3,705
|
3,784
|
|||
|
Net income attributable to noncontrolling interests
|
(5)
|
(9)
|
(28)
|
(26)
|
|||
|
Net income attributable to Medtronic
|
$ 654
|
$ 1,179
|
$ 3,676
|
$ 3,758
|
|||
|
Basic earnings per share
|
$ 0.49
|
$ 0.89
|
$ 2.77
|
$ 2.83
|
|||
|
Diluted earnings per share
|
$ 0.49
|
$ 0.88
|
$ 2.76
|
$ 2.82
|
|||
|
Basic weighted average shares outstanding
|
1,322.3
|
1,330.4
|
1,327.7
|
1,329.8
|
|||
|
Diluted weighted average shares outstanding
|
1,325.4
|
1,332.8
|
1,330.2
|
1,332.8
|
|||
|
The data in the schedule above has been intentionally rounded to the nearest million, and therefore, the quarterly amounts may not sum to the fiscal year-to-date amounts.
|
|
MEDTRONIC PLC
GAAP TO NON-GAAP RECONCILIATIONS(1)
(Unaudited)
|
|||||||||||||||||
|
Three months ended April 26, 2024
|
|||||||||||||||||
|
(in millions, except per share data)
|
Net
|
Cost of
|
Gross
|
Operating
|
Operating
|
Income
|
Net Income
|
Diluted
|
Effective
|
||||||||
|
GAAP
|
$ 8,589
|
$ 3,044
|
64.6 %
|
$ 1,053
|
12.3 %
|
$ 856
|
$ 654
|
$ 0.49
|
22.9 %
|
||||||||
|
Non-GAAP Adjustments:
|
|||||||||||||||||
|
Amortization of intangible assets
|
—
|
—
|
—
|
419
|
4.9
|
419
|
357
|
0.27
|
15.0
|
||||||||
|
Restructuring and associated costs (2)
|
—
|
(13)
|
0.2
|
152
|
1.8
|
152
|
125
|
0.09
|
17.8
|
||||||||
|
Acquisition and divestiture-related items (3)
|
—
|
(76)
|
0.9
|
611
|
7.1
|
611
|
515
|
0.39
|
15.9
|
||||||||
|
Certain litigation charges, net
|
—
|
—
|
—
|
44
|
0.5
|
44
|
37
|
0.03
|
15.9
|
||||||||
|
(Gain)/loss on minority investments (4)
|
—
|
—
|
—
|
—
|
—
|
195
|
197
|
0.15
|
(1.0)
|
||||||||
|
Medical device regulations (5)
|
—
|
(21)
|
0.2
|
31
|
0.4
|
31
|
27
|
0.02
|
12.9
|
||||||||
|
Certain tax adjustments, net
|
—
|
—
|
—
|
—
|
—
|
—
|
17
|
0.01
|
—
|
||||||||
|
Non-GAAP
|
$ 8,589
|
$ 2,934
|
65.8 %
|
$ 2,311
|
26.9 %
|
$ 2,309
|
$ 1,929
|
$ 1.46
|
16.2 %
|
||||||||
|
Currency impact
|
75
|
18
|
0.1
|
101
|
0.9
|
0.07
|
|||||||||||
|
Currency Adjusted
|
$ 8,664
|
$ 2,952
|
65.9 %
|
$ 2,412
|
27.8 %
|
$ 1.53
|
|||||||||||
|
Three months ended April 28, 2023
|
|||||||||||||||||
|
(in millions, except per share data)
|
Net
|
Cost of
|
Gross
|
Operating
|
Operating
|
Income
|
Net Income
|
Diluted
|
Effective
|
||||||||
|
GAAP
|
$ 8,544
|
$ 2,980
|
65.1 %
|
$ 1,565
|
18.3 %
|
$ 1,551
|
$ 1,179
|
$ 0.88
|
23.3 %
|
||||||||
|
Non-GAAP Adjustments:
|
|||||||||||||||||
|
Amortization of intangible assets
|
—
|
—
|
—
|
423
|
5.0
|
423
|
361
|
0.27
|
14.7
|
||||||||
|
Restructuring and associated costs (2)
|
—
|
(30)
|
0.4
|
372
|
4.4
|
372
|
288
|
0.22
|
22.6
|
||||||||
|
Acquisition and divestiture-related items (6)
|
—
|
(7)
|
0.1
|
139
|
1.6
|
139
|
131
|
0.10
|
5.8
|
||||||||
|
Certain litigation charges, net (7)
|
—
|
—
|
—
|
(30)
|
(0.4)
|
(30)
|
(22)
|
(0.02)
|
26.7
|
||||||||
|
(Gain)/loss on minority investments (4)
|
—
|
—
|
—
|
—
|
—
|
(10)
|
(7)
|
(0.01)
|
(20.0)
|
||||||||
|
Medical device regulations (5)
|
—
|
(25)
|
0.3
|
44
|
0.5
|
44
|
34
|
0.03
|
22.7
|
||||||||
|
Certain tax adjustments, net (8)
|
—
|
—
|
—
|
—
|
—
|
—
|
127
|
0.10
|
—
|
||||||||
|
Non-GAAP
|
$ 8,544
|
$ 2,917
|
65.9 %
|
$ 2,512
|
29.4 %
|
$ 2,488
|
$ 2,091
|
$ 1.57
|
15.8 %
|
||||||||
|
See description of non-GAAP financial measures contained in the press release dated May 23, 2024.
|
|
|
(1)
|
The data in this schedule has been intentionally rounded to the nearest million or $0.01 for EPS figures, and, therefore, may not sum.
|
|
(2)
|
Associated costs include costs incurred as a direct result of the restructuring program, such as salaries for employees supporting the program, consulting expenses, and asset write-offs.
|
|
(3)
|
The charges predominantly include $439 million of charges related to the February 20, 2024 decision to exit the Company’s ventilator product line, which primarily includes long-lived intangible asset impairments and inventory write-downs. In addition, other charges primarily consist of changes in fair value of contingent consideration.
|
|
(4)
|
We exclude unrealized and realized gains and losses on our minority investments as we do not believe that these components of income or expense have a direct correlation to our ongoing or future business operations.
|
|
(5)
|
The charges represent incremental costs of complying with the new European Union medical device regulations for previously registered products and primarily include charges for contractors supporting the project and other direct third-party expenses. We consider these costs to be duplicative of previously incurred costs and/or one-time costs, which are limited to a specific period.
|
|
(6)
|
The charges primarily include changes in the carrying value of the disposal group and other associated costs as a result of the April 2023 sale of half of the Company’s Renal Care Solutions (RCS) business, changes in fair value of contingent consideration, business combination costs, and associated costs related to the previously contemplated separation of the PMRI businesses.
|
|
(7)
|
Certain litigation includes $35 million related to the one-time payment received as a result of the Intellectual Property Agreement entered into with Edwards Lifesciences in April 2023.
|
|
(8)
|
The charge primarily relates to the reduction of deferred tax assets due to the disallowance of certain interest deductions and the change in the reporting currency for certain carryover attributes, and the impact from the sale of half of the Company’s RCS business.
|
|
MEDTRONIC PLC
GAAP TO NON-GAAP RECONCILIATIONS(1)
(Unaudited)
|
|||||||||||||||||
|
Fiscal year ended April 26, 2024
|
|||||||||||||||||
|
(in millions, except per share data)
|
Net
|
Cost of
|
Gross
|
Operating
|
Operating
|
Income
|
Net Income
|
Diluted
|
Effective
|
||||||||
|
GAAP
|
$ 32,364
|
$ 11,216
|
65.3 %
|
$ 5,144
|
15.9 %
|
$ 4,837
|
$ 3,676
|
$ 2.76
|
23.4 %
|
||||||||
|
Non-GAAP Adjustments:
|
|||||||||||||||||
|
Amortization of intangible assets
|
—
|
—
|
—
|
1,693
|
5.2
|
1,693
|
1,435
|
1.08
|
15.2
|
||||||||
|
Restructuring and associated costs (2)
|
—
|
(55)
|
0.2
|
389
|
1.2
|
389
|
323
|
0.24
|
17.0
|
||||||||
|
Acquisition and divestiture-related items (3)
|
—
|
(100)
|
0.3
|
777
|
2.4
|
777
|
664
|
0.50
|
14.5
|
||||||||
|
Certain litigation charges
|
—
|
—
|
—
|
149
|
0.5
|
149
|
118
|
0.09
|
20.8
|
||||||||
|
(Gain)/loss on minority investments (4)
|
—
|
—
|
—
|
—
|
—
|
308
|
305
|
0.23
|
0.6
|
||||||||
|
Medical device regulations (5)
|
—
|
(81)
|
0.3
|
119
|
0.4
|
119
|
97
|
0.07
|
18.5
|
||||||||
|
Certain tax adjustments, net (6)
|
—
|
—
|
—
|
—
|
—
|
—
|
299
|
0.22
|
—
|
||||||||
|
Non-GAAP
|
$ 32,364
|
$ 10,980
|
66.1 %
|
$ 8,272
|
25.6 %
|
$ 8,273
|
$ 6,918
|
$ 5.20
|
16.0 %
|
||||||||
|
Currency impact
|
(31)
|
(114)
|
0.3
|
507
|
1.6
|
0.33
|
|||||||||||
|
Currency Adjusted
|
$ 32,333
|
$ 10,866
|
66.4 %
|
$ 8,779
|
27.2 %
|
$ 5.53
|
|||||||||||
|
Fiscal year ended April 28, 2023
|
|||||||||||||||||
|
(in millions, except per share data)
|
Net
|
Cost of
|
Gross
|
Operating
|
Operating
|
Income
|
Net Income
|
Diluted
|
Effective
|
||||||||
|
GAAP
|
$ 31,227
|
$ 10,719
|
65.7 %
|
$ 5,485
|
17.6 %
|
$ 5,364
|
$ 3,758
|
$ 2.82
|
29.5 %
|
||||||||
|
Non-GAAP Adjustments:
|
|||||||||||||||||
|
Amortization of intangible assets
|
—
|
—
|
—
|
1,698
|
5.4
|
1,698
|
1,443
|
1.08
|
15.0
|
||||||||
|
Restructuring and associated costs (2)
|
—
|
(97)
|
0.3
|
647
|
2.1
|
647
|
507
|
0.38
|
21.5
|
||||||||
|
Acquisition and divestiture-related items (7)
|
—
|
(66)
|
0.2
|
345
|
1.1
|
345
|
316
|
0.24
|
8.4
|
||||||||
|
Certain litigation charges, net (8)
|
—
|
—
|
—
|
(30)
|
(0.1)
|
(30)
|
(23)
|
(0.02)
|
26.7
|
||||||||
|
(Gain)/loss on minority investments (4)
|
—
|
—
|
—
|
—
|
—
|
(33)
|
(29)
|
(0.02)
|
(6.1)
|
||||||||
|
Medical device regulations (5)
|
—
|
(88)
|
0.3
|
150
|
0.5
|
150
|
120
|
0.09
|
20.0
|
||||||||
|
Debt redemption premium and other charges (9)
|
—
|
—
|
—
|
—
|
—
|
53
|
42
|
0.03
|
20.8
|
||||||||
|
Certain tax adjustments, net (10)
|
—
|
—
|
—
|
—
|
—
|
—
|
910
|
0.68
|
—
|
||||||||
|
Non-GAAP
|
$ 31,227
|
$ 10,469
|
66.5 %
|
$ 8,295
|
26.6 %
|
$ 8,194
|
$ 7,045
|
$ 5.29
|
13.8 %
|
||||||||
|
See description of non-GAAP financial measures contained in the press release dated May 23, 2024.
|
|
|
(1)
|
The data in this schedule has been intentionally rounded to the nearest million or $0.01 for EPS figures, and, therefore, may not sum.
|
|
(2)
|
Associated costs include costs incurred as a direct result of the restructuring program, such as salaries for employees supporting the program, consulting expenses, and asset write-offs.
|
|
(3)
|
The charges predominantly include $439 million of charges related to the February 20, 2024 decision to exit the Company’s ventilator product line, which primarily includes long-lived intangible asset impairments and inventory write-downs. In addition, other charges primarily consist of changes in fair value of contingent consideration and associated costs related to the previously contemplated separation of the PMRI businesses.
|
|
(4)
|
We exclude unrealized and realized gains and losses on our minority investments as we do not believe that these components of income or expense have a direct correlation to our ongoing or future business operations.
|
|
(5)
|
The charges represent incremental costs of complying with the new European Union medical device regulations for previously registered products and primarily include charges for contractors supporting the project and other direct third-party expenses. We consider these costs to be duplicative of previously incurred costs and/or one-time costs, which are limited to a specific time period.
|
|
(6)
|
The net charge primarily relates to an income tax reserve adjustment associated with the June 2023, Israeli Central-Lod District Court decision and the establishment of a valuation allowance against certain net operating losses which were partially offset by a benefit from the change in a Swiss Cantonal tax rate associated with previously established deferred tax assets from intercompany intellectual property transactions and the step up in tax basis for Swiss Cantonal purposes.
|
|
(7)
|
The charges predominantly include non-cash pre-tax impairments, primarily related to goodwill, changes in the carrying value of the disposal group, and other associated costs, as a result of the April 2023 sale of half of the Company’s Renal Care Solutions (RCS) business; business combination costs, and associated costs related to the previously contemplated separation of the PMRI businesses.
|
|
(8)
|
Certain litigation includes $35 million income related to the one-time payment received as a result of the Intellectual Property Agreement entered into with Edwards Lifesciences in April 2023.
|
|
(9)
|
The charges relate to the early redemption of approximately $2.3 billion of debt and were recorded within interest expense, net within the consolidated statements of income.
|
|
(10)
|
The charge primarily relates to a $764 million reserve adjustment that was a direct result of the U.S. Tax Court opinion, issued in August 2022, on the previously disclosed litigation regarding the allocation of income between Medtronic, Inc. and its wholly owned subsidiary operating in Puerto Rico. Additional charges relate to the reduction of deferred tax assets due to the disallowance of certain interest deductions and the change in the reporting currency for certain carryover attributes, and the amortization on previously established deferred tax assets from intercompany intellectual property transactions.
|
|
MEDTRONIC PLC
GAAP TO NON-GAAP RECONCILIATIONS(1)
(Unaudited)
|
|||||||||||||||
|
Three months ended April 26, 2024
|
|||||||||||||||
|
(in millions)
|
Net
|
SG&A
|
SG&A Expense
|
R&D
|
R&D Expense
|
Other Operating
|
Other Operating
|
Other
|
|||||||
|
GAAP
|
$ 8,589
|
$ 2,765
|
32.2 %
|
$ 675
|
7.9 %
|
$ 477
|
5.6 %
|
$ (4)
|
|||||||
|
Non-GAAP Adjustments:
|
|||||||||||||||
|
Restructuring and associated costs (2)
|
—
|
(28)
|
(0.3)
|
—
|
—
|
—
|
—
|
—
|
|||||||
|
Acquisition and divestiture-related items (3)
|
—
|
(6)
|
(0.1)
|
—
|
—
|
(530)
|
(6.2)
|
—
|
|||||||
|
Medical device regulations (4)
|
—
|
(1)
|
—
|
(9)
|
(0.1)
|
—
|
—
|
—
|
|||||||
|
(Gain)/loss on minority investments (5)
|
—
|
—
|
—
|
—
|
—
|
—
|
—
|
(195)
|
|||||||
|
Non-GAAP
|
$ 8,589
|
$ 2,731
|
31.8 %
|
$ 666
|
7.8 %
|
$ (52)
|
(0.6) %
|
$ (200)
|
|||||||
|
Fiscal year ended April 26, 2024
|
|||||||||||||||
|
(in millions)
|
Net
|
SG&A
|
SG&A Expense
|
R&D
|
R&D Expense
|
Other Operating
|
Other Operating
|
Other
|
|||||||
|
GAAP
|
$ 32,364
|
$ 10,736
|
33.2 %
|
$ 2,735
|
8.5 %
|
$ 464
|
1.4 %
|
$ (412)
|
|||||||
|
Non-GAAP Adjustments:
|
|||||||||||||||
|
Restructuring and associated costs (2)
|
—
|
(108)
|
(0.3)
|
—
|
—
|
—
|
—
|
—
|
|||||||
|
Acquisition and divestiture-related items (3)
|
—
|
(71)
|
(0.2)
|
—
|
—
|
(606)
|
(1.9)
|
—
|
|||||||
|
Medical device regulations (4)
|
—
|
(2)
|
—
|
(36)
|
(0.1)
|
—
|
—
|
—
|
|||||||
|
(Gain)/loss on minority investments (5)
|
—
|
—
|
—
|
—
|
—
|
—
|
—
|
(308)
|
|||||||
|
Non-GAAP
|
$ 32,364
|
$ 10,555
|
32.6 %
|
$ 2,698
|
8.3 %
|
$ (141)
|
(0.4) %
|
$ (720)
|
|||||||
|
See description of non-GAAP financial measures contained in the press release dated May 23, 2024.
|
|
|
(1)
|
The data in this schedule has been intentionally rounded to the nearest million, and, therefore, may not sum.
|
|
(2)
|
Associated costs include costs incurred as a direct result of the restructuring program, such as salaries for employees supporting the program and consulting expenses.
|
|
(3)
|
The charges predominantly include $439 million of charges related to the February 20, 2024 decision to exit the Company’s ventilator product line, which primarily includes long-lived intangible asset impairments. In addition, other charges primarily related to changes in fair of contingent consideration and associated costs related to the previously contemplated separation of the PMRI businesses.
|
|
(4)
|
The charges represent estimated incremental costs of complying with the new European Union medical device regulations for previously registered products and primarily include charges for contractors supporting the project and other direct third-party expenses. We consider these costs to be duplicative of previously incurred costs and/or one-time costs, which are limited to a specific time period.
|
|
(5)
|
We exclude unrealized and realized gains and losses on our minority investments as we do not believe that these components of income or expense have a direct correlation to our ongoing or future business operations.
|
|
MEDTRONIC PLC
GAAP TO NON-GAAP RECONCILIATIONS(1)
(Unaudited)
|
|||||
|
Fiscal Year
|
|||||
|
(in millions)
|
2024
|
2023
|
2022
|
||
|
Net cash provided by operating activities
|
$ 6,787
|
$ 6,039
|
$ 7,346
|
||
|
Additions to property, plant, and equipment
|
(1,587)
|
(1,459)
|
(1,368)
|
||
|
Free Cash Flow (2)
|
$ 5,200
|
$ 4,580
|
$ 5,978
|
||
|
See description of non-GAAP financial measures contained in the press release dated May 23, 2024.
|
|
|
(1)
|
The data in this schedule has been intentionally rounded to the nearest million, and therefore, may not sum.
|
|
(2)
|
Free cash flow represents operating cash flows less property, plant, and equipment additions.
|
|
MEDTRONIC PLC
CONSOLIDATED BALANCE SHEETS
(Unaudited)
|
||||
|
(in millions)
|
April 26, 2024
|
April 28, 2023
|
||
|
ASSETS
|
||||
|
Current assets:
|
||||
|
Cash and cash equivalents
|
$ 1,284
|
$ 1,543
|
||
|
Investments
|
6,721
|
6,416
|
||
|
Accounts receivable, less allowances and credit losses of $173 and $176, respectively
|
6,128
|
5,998
|
||
|
Inventories, net
|
5,217
|
5,293
|
||
|
Other current assets
|
2,584
|
2,425
|
||
|
Total current assets
|
21,935
|
21,675
|
||
|
Property, plant, and equipment, net
|
6,131
|
5,569
|
||
|
Goodwill
|
40,986
|
41,425
|
||
|
Other intangible assets, net
|
13,225
|
14,844
|
||
|
Tax assets
|
3,657
|
3,477
|
||
|
Other assets
|
4,047
|
3,959
|
||
|
Total assets
|
$ 89,981
|
$ 90,948
|
||
|
LIABILITIES AND EQUITY
|
||||
|
Current liabilities:
|
||||
|
Current debt obligations
|
$ 1,092
|
$ 20
|
||
|
Accounts payable
|
2,410
|
2,662
|
||
|
Accrued compensation
|
2,375
|
1,949
|
||
|
Accrued income taxes
|
1,330
|
840
|
||
|
Other accrued expenses
|
3,582
|
3,581
|
||
|
Total current liabilities
|
10,789
|
9,051
|
||
|
Long-term debt
|
23,932
|
24,344
|
||
|
Accrued compensation and retirement benefits
|
1,101
|
1,093
|
||
|
Accrued income taxes
|
1,859
|
2,360
|
||
|
Deferred tax liabilities
|
515
|
708
|
||
|
Other liabilities
|
1,365
|
1,727
|
||
|
Total liabilities
|
39,561
|
39,283
|
||
|
Commitments and contingencies
|
||||
|
Shareholders’ equity:
|
||||
|
Ordinary shares— par value $0.0001, 2.6 billion shares authorized, 1,311,337,531 and
|
—
|
—
|
||
|
Additional paid-in capital
|
23,129
|
24,590
|
||
|
Retained earnings
|
30,403
|
30,392
|
||
|
Accumulated other comprehensive loss
|
(3,318)
|
(3,499)
|
||
|
Total shareholders’ equity
|
50,214
|
51,483
|
||
|
Noncontrolling interests
|
206
|
182
|
||
|
Total equity
|
50,420
|
51,665
|
||
|
Total liabilities and equity
|
$ 89,981
|
$ 90,948
|
||
|
The data in this schedule has been intentionally rounded to the nearest million, and, therefore, may not sum.
|
|
MEDTRONIC PLC
CONSOLIDATED STATEMENTS OF CASH FLOWS
(Unaudited)
|
|||||
|
Fiscal Year
|
|||||
|
(in millions)
|
2024
|
2023
|
2022
|
||
|
Operating Activities:
|
|||||
|
Net income
|
$ 3,705
|
$ 3,784
|
$ 5,062
|
||
|
Adjustments to reconcile net income to net cash provided by operating activities:
|
|||||
|
Depreciation and amortization
|
2,647
|
2,697
|
2,707
|
||
|
Provision for credit losses
|
90
|
73
|
58
|
||
|
Deferred income taxes
|
(508)
|
(226)
|
(604)
|
||
|
Stock-based compensation
|
393
|
355
|
359
|
||
|
Loss on debt extinguishment
|
—
|
53
|
—
|
||
|
Asset impairments and inventory write-downs
|
371
|
—
|
515
|
||
|
Other, net
|
573
|
270
|
138
|
||
|
Change in operating assets and liabilities, net of acquisitions and divestitures:
|
|||||
|
Accounts receivable, net
|
(391)
|
(576)
|
(477)
|
||
|
Inventories, net
|
(139)
|
(939)
|
(560)
|
||
|
Accounts payable and accrued liabilities
|
391
|
696
|
213
|
||
|
Other operating assets and liabilities
|
(345)
|
(148)
|
(65)
|
||
|
Net cash provided by operating activities
|
6,787
|
6,039
|
7,346
|
||
|
Investing Activities:
|
|||||
|
Acquisitions, net of cash acquired
|
(211)
|
(1,867)
|
(91)
|
||
|
Additions to property, plant, and equipment
|
(1,587)
|
(1,459)
|
(1,368)
|
||
|
Purchases of investments
|
(7,748)
|
(7,514)
|
(9,882)
|
||
|
Sales and maturities of investments
|
7,441
|
7,343
|
9,692
|
||
|
Other investing activities, net
|
(261)
|
4
|
(10)
|
||
|
Net cash used in investing activities
|
(2,366)
|
(3,493)
|
(1,659)
|
||
|
Financing Activities:
|
|||||
|
Change in current debt obligations, net
|
1,073
|
—
|
—
|
||
|
Proceeds from short-term borrowings (maturities greater than 90 days)
|
—
|
2,284
|
—
|
||
|
Repayments from short-term borrowings (maturities greater than 90 days)
|
—
|
(2,279)
|
—
|
||
|
Issuance of long-term debt
|
—
|
5,409
|
—
|
||
|
Payments on long-term debt
|
—
|
(6,012)
|
(1)
|
||
|
Dividends to shareholders
|
(3,666)
|
(3,616)
|
(3,383)
|
||
|
Issuance of ordinary shares
|
284
|
308
|
429
|
||
|
Repurchase of ordinary shares
|
(2,138)
|
(645)
|
(2,544)
|
||
|
Other financing activities
|
(3)
|
(409)
|
163
|
||
|
Net cash used in financing activities
|
(4,450)
|
(4,960)
|
(5,336)
|
||
|
Effect of exchange rate changes on cash and cash equivalents
|
(230)
|
243
|
(231)
|
||
|
Net change in cash and cash equivalents
|
(259)
|
(2,171)
|
121
|
||
|
Cash and cash equivalents at beginning of period
|
1,543
|
3,714
|
3,593
|
||
|
Cash and cash equivalents at end of period
|
$ 1,284
|
$ 1,543
|
$ 3,714
|
||
|
Supplemental Cash Flow Information
|
|||||
|
Cash paid for:
|
|||||
|
Income taxes
|
$ 1,622
|
$ 1,548
|
$ 996
|
||
|
Interest
|
826
|
606
|
540
|
||
|
The data in this schedule has been intentionally rounded to the nearest million, and, therefore, may not sum.
|
About Medtronic
Bold thinking. Bolder actions. We are Medtronic. Medtronic plc, headquartered in Dublin, Ireland, is the leading global healthcare technology company that boldly attacks the most challenging health problems facing humanity by searching out and finding solutions. Our Mission — to alleviate pain, restore health, and extend life — unites a global team of 95,000+ passionate people across 150 countries. Our technologies and therapies treat 70 health conditions and include cardiac devices, surgical robotics, insulin pumps, surgical tools, patient monitoring systems, and more. Powered by our diverse knowledge, insatiable curiosity, and desire to help all those who need it, we deliver innovative technologies that transform the lives of two people every second, every hour, every day. Expect more from us as we empower insight-driven care, experiences that put people first, and better outcomes for our world. In everything we do, we are engineering the extraordinary. For more information on Medtronic (NYSE:MDT), visit www.Medtronic.com and follow on X and LinkedIn.
FORWARD LOOKING STATEMENTS
This press release contains forward-looking statements within the meaning of the Private Securities Litigation Reform Act of 1995, which are subject to risks and uncertainties, including risks related to competitive factors, difficulties and delays inherent in the development, manufacturing, marketing and sale of medical products, government regulation, geopolitical conflicts, general economic conditions, and other risks and uncertainties described in the company’s periodic reports on file with the U.S. Securities and Exchange Commission including the most recent Annual Report on Form 10-K of the company. In some cases, you can identify these statements by forward-looking words or expressions, such as “anticipate,” “believe,” “could,” “estimate,” “expect,” “forecast,” “intend,” “looking ahead,” “may,” “plan,” “possible,” “potential,” “project,” “should,” “going to,” “will,” and similar words or expressions, the negative or plural of such words or expressions and other comparable terminology. Actual results may differ materially from anticipated results. Medtronic does not undertake to update its forward-looking statements or any of the information contained in this press release, including to reflect future events or circumstances.
NON-GAAP FINANCIAL MEASURES
This press release contains financial measures, including adjusted net income, adjusted diluted EPS, and organic revenue, which are considered “non-GAAP” financial measures under applicable SEC rules and regulations. References to quarterly or annual figures increasing, decreasing or remaining flat are in comparison to fiscal year 2023.
Medtronic management believes that non-GAAP financial measures provide information useful to investors in understanding the company’s underlying operational performance and trends and to facilitate comparisons with the performance of other companies in the med tech industry. Non-GAAP net income and diluted EPS exclude the effect of certain charges or gains that contribute to or reduce earnings but that result from transactions or events that management believes may or may not recur with similar materiality or impact to operations in future periods (Non-GAAP Adjustments). Medtronic generally uses non-GAAP financial measures to facilitate management’s review of the operational performance of the company and as a basis for strategic planning. Non-GAAP financial measures should be considered supplemental to and not a substitute for financial information prepared in accordance with U.S. generally accepted accounting principles (GAAP), and investors are cautioned that Medtronic may calculate non-GAAP financial measures in a way that is different from other companies. Management strongly encourages investors to review the company’s consolidated financial statements and publicly filed reports in their entirety. Reconciliations of the non-GAAP financial measures to the most directly comparable GAAP financial measures are included in the financial schedules accompanying this press release.
Medtronic calculates forward-looking non-GAAP financial measures based on internal forecasts that omit certain amounts that would be included in GAAP financial measures. For instance, forward-looking organic revenue growth guidance excludes the impact of foreign currency fluctuations, as well as significant acquisitions or divestitures. Forward-looking diluted non-GAAP EPS guidance also excludes other potential charges or gains that would be recorded as Non-GAAP Adjustments to earnings during the fiscal year. Medtronic does not attempt to provide reconciliations of forward-looking non-GAAP EPS guidance to projected GAAP EPS guidance because the combined impact and timing of recognition of these potential charges or gains is inherently uncertain and difficult to predict and is unavailable without unreasonable efforts. In addition, the company believes such reconciliations would imply a degree of precision and certainty that could be confusing to investors. Such items could have a substantial impact on GAAP measures of financial performance.
|
Contacts:
|
|
|
Erika Winkels
|
Ryan Weispfenning
|
|
Public Relations
|
Investor Relations
|
|
+1-763-526-8478
|
+1-763-505-4626
|
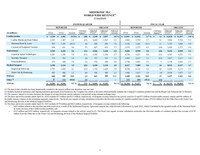
")
SOURCE Medtronic plc

The spotlight next week will shift somewhat to the Federal Reserve’s second-quarter earnings season and monetary policy. Market watchers will be treated to results from several major names, including Dow 30 components Goldman Sachs (GS), UnitedHealth (UNH), Johnson & Johnson (JNJ) and American Express (AXP), along with streaming giant Netflix (NFLX).
The Fed will still attract some attention as investors will be eager to hear from a packed lineup of central bank speakers just before the policy meeting lockout period.
In terms of the economic calendar, after fifteen days of labor market and inflation indicators, activity data will gain momentum in the form of the latest retail sales and industrial production reports.
Earnings Highlight: Monday, July 15 – Goldman Sachs (GS) and BlackRock (Black). See the full earnings calendar.
Earnings Highlight: Tuesday, July 16 – UnitedHealth (UNH), Bank of America (BAC), Progressive (PGR), Morgan Stanley (IN), PNC Financial (PNC) and JB Hunt Transport (JBHT). See the full earnings calendar.
Earnings Highlight: Wednesday, July 17 – Johnson & Johnson (JNJ), US Bancorp (USB), Morgan Children (KMI), United Airlines (UAL) and Ally Financial (ALLY). See the full earnings calendar.
Earnings Highlight: Thursday, July 18 – Netflix (NFLX), Abbott Laboratories (ABT), Black stone (BX), Domino’s pizza (ZDP) and Taiwan Semiconductor Manufacturing (TSM). See the full earnings calendar.
Earnings Highlight: Friday, July 19 – American Express (AXP), Halliburton (THANKS) and Travelers (VRT (return to recoverable value)) See the full earnings calendar.
IPO Observation: Hospital and healthcare clinic operator Ardent Health Partners (TARDT), insurance service provider Twfg (TWFG) and the biotechnology company Lirum Therapeutics (LRTX) are expected to price their IPOs and begin trading next week. The analyst quiet period ends at Rectitude (RECT) to free up analysts to publish ratings.

Police cars outside the residence of Thomas Matthew Crooks, the suspected shooter at a Trump rally on Saturday, investigate the area in Pennsylvania. Following the incident, one rally attendee was killed, two rally attendees are in critical condition and Donald Trump suffered a non-fatal gunshot wound. The shooter is dead after being shot dead by the United States Secret Service. (Photo by Kyle Mazza/Anadolu via Getty Images)
Investors will initially favor traditional safe-haven assets and may lean toward trades more closely tied to former President Donald Trump’s chances of winning the White House after he survived an assassination attempt, according to market watchers.
“There will undoubtedly be some protectionist or safe-haven flows into Asia early this morning,” said Nick Twidale, chief market analyst at ATFX Global Markets. “I suspect gold could test all-time highs, we’ll see the yen being bought and the dollar, and flows into Treasuries as well.”
Early market commentary suggested Trump’s shooting at a rally in Pennsylvania on Saturday could also prompt traders to increase his likelihood of success in the November election. His support for looser fiscal policy and higher tariffs is generally seen as likely to benefit the dollar and weaken Treasuries.
An indicator of market sentiment heading into the weekend: Bitcoin surged above $60,000, likely reflecting Trump’s pro-crypto stance.
Other assets positively linked to the so-called Trump trade include stocks of energy companies, private prisons, credit card companies and health insurers.
Traders will also be closely watching market measures of expected volatility on Monday, such as those in the tariff-sensitive Chinese yuan and Mexican peso, which have begun to price in the U.S. vote.
Trump said he was shot in the right ear after a shooting at his rally. His campaign said in a statement that he was “fine” after the incident, which prompted him to rush off the stage.
“Currencies will be the first major market on Monday in Asia to react to the weekend’s shots. There’s potential for extra volatility, and getting a clear reading could be especially difficult because liquidity will be hurt by Japan’s national holiday,” said Garfield Reynolds, Asia team leader for Bloomberg Markets Live.
Strategists had already expected a volatile run-up to the election, particularly as Democrats are still agonizing over President Joe Biden’s candidacy after his poor performance in last month’s debate raised questions about his age. Investors were also grappling with the possibility that the election could end in a drawn-out dispute or political violence.
But there is little precedent for events like those in Pennsylvania. When President Ronald Reagan was shot four decades ago, the stock market plunged before closing early. The next day, March 31, 1981, the S&P 500 rose more than 1% and benchmark 10-year Treasury yields fell 9 basis points to 13.13%, according to data compiled by Bloomberg.
Bond investors should pay particular attention as the attack is likely to boost Trump’s election chances and ultimately lead to concerns about the fiscal outlook, according to Marko Papic, chief strategist at California-based BCA Research Inc.
“The bond market must at some point become aware of President Trump’s greater chances of winning the White House than any of his rivals,” Papic wrote. “And I continue to believe that as his chances increase, so too must the likelihood of a bond market revolt.”
Kyle Rodda, senior financial markets analyst at Capital.com, said he was seeing client flows into Bitcoin and gold following the shooting.
“This news marks a turning point in American policy norms,” he said. “For markets, it means safe-haven trades, but more tilted toward non-traditional safe-havens.”

Follow us for stories on Bill Gates, Elon Musk, Mukesh Ambani, Gautam Adani as we bring you everything that’s happening in the business world. Follow the latest gold and silver prices here too. Stay in the know on all things business with us.
Latest news on July 11, 2024: Airtel says its new Xstream Fiber plans bundle over 350 live TV channels (Official Photo) (Reuters) Disclaimer: This is an AI-generated live blog and has not been edited by Hindustan Times staff.
Follow all the updates here:
-
Thu, 11 Jul 2024 08:44 PM
Business News LIVE Updates: Decoding Airtel’s new Xstream Fiber packages, finding value with Live TV and OTT
- Airtel confirms to HT that the live TV proposition is being delivered using its DTH network, while the bundled streaming subscriptions are an extension of its Xstream Play platform.
-
Thu, 11 Jul 2024 03:58 PM
Business News LIVE Updates: TCS Q1 results meet estimates: Net profit up 9%, ₹10 dividend declared
- TCS’s consolidated revenue rose 5.4% to Rs 626.13 billion in the June quarter. Analysts had expected revenue of Rs 622.07 billion, as per LSEG data.
-
Thu, 11 Jul 2024 03:51 PM
Business News LIVE Updates: Indian companies falsified generic Viagra data to get approval, says US FDA: Report
- Synapse Labs Pvt. Ltd may have been used in hundreds of drugs that are still available for sale, the report said.
-
Thu, 11 Jul 2024 03:09 PM
LIVE Business News Updates: Namita Thapar’s emotional post on Emcure IPO listing: ‘Mirza Ghalib sums up my feelings’
- Emcure Pharmaceuticals was listed at ₹1,325.05, up 31.45% on the BSE and NSE on July 10.
-
Thu, 11 Jul 2024 02:39 PM
LIVE business news updates: Amazon could face investigation over treatment of UK food suppliers, watchdog says
- An Amazon spokesperson said the company has made several improvements for food suppliers since last year’s results.
-
Thu, 11 Jul 2024 01:39 PM
LIVE Business News Updates: This Bengaluru company aims to launch a ‘space habitat’ by 2027, in talks with SpaceX
- AkashaLabdhi calls itself a “home among the stars” as it says the company’s area of expertise is signal processing and continuous automation.
-
Thu, 11 Jul 2024 01:10 PM
Business News LIVE Updates: Amazon India employees on working conditions: Made to stand for hours, bathroom breaks not allowed
- A survey conducted by UNI Global Union with the Amazon India Workers Association had 1,838 participants who alleged appalling working conditions at Amazon facilities in India.
-
Thu, 11 Jul 2024 12:44 PM
LIVE Business News Updates: UK overhauls listing rules in bid to attract IPOs to London: What has changed?
- The new rules allow companies to carry out more activities without putting them to a shareholder vote, the UK’s Financial Conduct Authority said.
-
Thu, 11 Jul 2024 12:18 PM
Business News LIVE Updates: Want to send money abroad? Open foreign currency accounts at GIFT City
- Foreign currency accounts will be like a bank account in India, but instead of rupees, you hold foreign currency like US dollars.
-
Thu, 11 Jul 2024 11:30 AM
Business News LIVE Updates: First Abu Dhabi Bank denies interest in acquiring stake in Yes Bank: Report
- The report said the Yes Bank stake sale has attracted interest from Japan, including Mitsubishi UFJ Financial Group Inc. and Sumitomo Mitsui Financial Group Inc.
-
Thu, 11 Jul 2024 11:04 AM
LIVE Business News Updates: TCS Share Price Surges Ahead of Q1 Results: What Brokers Say About the Stock
- TCS Share Price: The stock opened at ₹3,944.65 against its previous close of ₹3,909.90. It then rose 1.8 percent to ₹3,979.90 level.
-
Thu, 11 Jul 2024 10:22 AM
LIVE Business News Updates: Reliance Jio IPO listing likely in 2025 at $112 billion valuation: Jefferies
- Jio “could list at a valuation of $112 billion” and add “7-15 percent upside” to Reliance Industries’ share price, Jefferies said.
-
Thu, 11 Jul 2024 09:42 AM
LIVE Business News Updates: Yes Bank shares rise after Moody’s revises outlook to ‘positive’ from ‘stable’
- Global rating agency Moody’s has raised its outlook on Yes Bank to positive from “stable” despite expectations of a gradual improvement in its depositor base.
-
Thu, 11 Jul 2024 09:16 AM
Business News LIVE Updates: Sahaj Solar IPO opens today: All you need to know before subscribing to the issue
- Sahaj Solar IPO: The block issue aims to raise ₹52.56 crore through issuance of 2.92 million new shares and will close on July 15.
-
Thu, 11 Jul 2024 08:40 AM
LIVE Business News Updates: Why Analysts Believe India’s Earnings Season May Disappoint Stock Market Investors
- Investors in Indian stocks hoping for a robust earnings season to justify expensive valuations are likely to be disappointed.
-
Thu, 11 Jul 2024 08:35 AM
LIVE Business News Updates: Elon Musk Says Second Neuralink Brain Implant Will ‘Give People Superpowers’ Within a Week
- Elon Musk said Neuralink will make some changes to try to alleviate the problem of its electrode wires retracting from brain tissue.
-
Thu, 11 Jul 2024 07:59 AM
LIVE Business News Updates: Apple warns Indian iPhone users of possible Pegasus-like ‘spyware attack’
- In April this year, the Indian Computer Emergency Response Team (Cert-In) flagged several vulnerabilities in Apple’s operating system for iPhone and iPad.
-
Thu, 11 Jul 2024 07:45 AM
Business News LIVE Updates: US stock markets at record highs led by world’s biggest tech companies
- The Philadelphia Semiconductor Index rose 2.4% to a record high after Taiwan Semiconductor Manufacturing Co. reported strong quarterly revenue.
{{^userSubscribed}} {{/userSubscribed}} {{^userSubscribed}} {{/userSubscribed}}
{{^userSubscribed}} {{/userSubscribed}} {{^userSubscribed}} {{/userSubscribed}}
{{^userSubscribed}} {{/userSubscribed}} {{^userSubscribed}} {{/userSubscribed}}
{{^userSubscribed}} {{/userSubscribed}} {{^userSubscribed}} {{/userSubscribed}}
{{^userSubscribed}} {{/userSubscribed}} {{^userSubscribed}} {{/userSubscribed}}
{{^userSubscribed}} {{/userSubscribed}} {{^userSubscribed}} {{/userSubscribed}}
News / Business / Latest Business News Live Updates Today, July 11, 2024
Source
News
Jio Financial share price: Should you buy this Reliance group stock on Monday ahead of Q1 FY2024 results?

Q1 2024 Results: Jio Financial Share Price will be in focus on Monday as the Reliance Group company has a fixed board meeting on July 15, 2024 to consider and approve the company’s unaudited standalone and consolidated financial results. Trust Group company informed about the Q1 2024 Results date on Wednesday last week via an exchange filing. According to stock market experts, Jio Financial Services Limited is poised to deliver impressive Q1 results for FY25 on solid operating income. They have forecast a healthy QoQ PAT for the company in Q1 FY25.
Jio Financial Services News
Speaking on the Jio Financial Services Q1 2024 results, Manish Chowdhury, Head of Research, StoxBox, said, “We believe Jio Financial Services is poised to deliver impressive results in Q1FY25 aided by its operating income, which is likely to show robust growth driven by strong investment income, which in turn should lead to healthy PAT growth on a sequential basis. Jio Financial Services continues to make strategic moves such as launching digital products and expanding its ecosystem, with a clear focus on future growth. The company has announced plans to introduce products for lending against stocks and mutual funds, leveraging Jio’s large user base, which could be a significant growth driver in the coming quarters.”
“Furthermore, with the NBFC receiving RBI approval to become a primary investment company, Jio Financial Services is well-positioned to unlock value from its investments. Overall, we expect the company to report robust numbers in the upcoming quarter,” the StoxBox expert added.
Jio Financial Stock Target Price
Speaking about the technical outlook of Jio Financial share price, Ganesh Dongre, Senior Manager, Technical Research at Anand Rathi, said, “Jio Financial Services share price is poised to make a fresh high at the ₹260 apiece level. If the stock breaks above this mark, the Reliance Group stock could make a fresh high by touching the ₹290-₹295 zone. Hence, those with Jio Finance stock in their portfolio are advised to stick to the script by keeping a stop loss at ₹205. If the stock breaks above ₹260 decisively, then one can upgrade the stop loss at ₹240 for the near-term target of ₹295.”
On the advice to new buyers regarding Jio Financial stock, Ganesh Dongre said, “New buyers are advised to wait for the breakout. Once the stock breaks above ₹260, one can buy this Reliance Group stock at the short term target of ₹295, keeping a stop loss of ₹240 apiece.”
Disclaimer: The views and recommendations made above are those of individual analysts or brokerage firms, and not of Mint. Investors are advised to consult with certified experts before making any investment decisions.
3.6 Crore Indians visited in a single day choosing us as India’s undisputed platform for General Election Results. Explore Latest Updates here!
Topics that may interest you

“This could be the greatest coverage in history” – Whitney leaves a new bomb

Start! This market model is about to unleash the biggest manifestation ever – Dylan Leclair

“The list of epstein is real and Trump knows who he is on it” – Whitney Webb makes New Epstein Bombshell fall

“I did mathematics! Bitcoin is about to destroy records” – Samson Mow and Jack Mallers

“Blackrock games exposed: you are watching a bull that are engineered” – Matt Hugan

Switchboard Revolutionizes DeFi with New Oracle Aggregator

Latest Business News Live Updates Today, July 11, 2024

Is Zypto Wallet a Reliable Choice for DeFi Users?

👀 Lido prepares its response to the recovery boom

FinTech LIVE New York: Mastercard and the Power of Partnership
“This could be the greatest coverage in history” – Whitney leaves a new bomb
Start! This market model is about to unleash the biggest manifestation ever – Dylan Leclair
“The list of epstein is real and Trump knows who he is on it” – Whitney Webb makes New Epstein Bombshell fall
“I did mathematics! Bitcoin is about to destroy records” – Samson Mow and Jack Mallers
“Blackrock games exposed: you are watching a bull that are engineered” – Matt Hugan
-
 DeFi1 year ago
Switchboard Revolutionizes DeFi with New Oracle Aggregator
-
 News1 year ago
Latest Business News Live Updates Today, July 11, 2024
-
 DeFi1 year ago
Is Zypto Wallet a Reliable Choice for DeFi Users?
-
 DeFi1 year ago
👀 Lido prepares its response to the recovery boom
-
 Fintech1 year ago
FinTech LIVE New York: Mastercard and the Power of Partnership
-

 DeFi1 year ago
Ethena downplays danger of letting traders use USDe to back risky bets – DL News
-

 Fintech1 year ago
121 Top Fintech Companies & Startups To Know In 2024
-

 ETFs1 year ago
Gold ETFs see first outing after March 2023 at ₹396 cr on profit booking
-

 DeFi1 year ago
TON Network Surpasses $200M TVL, Boosted by Open League and DeFi Growth ⋆ ZyCrypto
-

 Fintech1 year ago
Fintech unicorn Zeta launches credit as a UPI-linked service for banks
-

 ETFs1 year ago
Largest US Bank Invests in Spot BTC ETFs While Dimon Remains a Bitcoin Hater ⋆ ZyCrypto
-

 News1 year ago
Salesforce Q1 2025 Earnings Report (CRM)